
Elliott Wave chart analysis for the S&P 500 for 7th November, 2011. Please click on the charts below to enlarge.
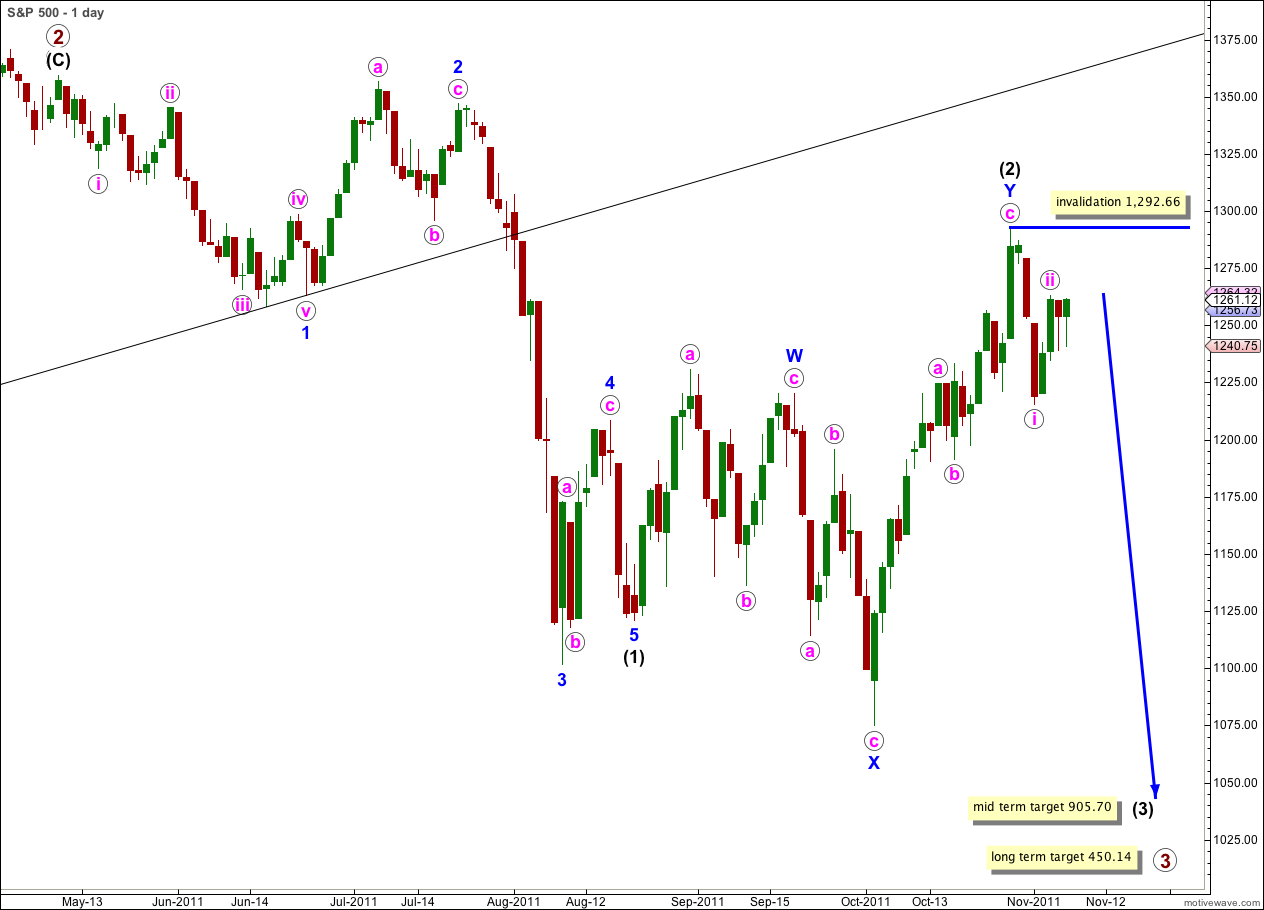
Price has moved sideways and a little higher, but remains below the invalidation point at 1,263.21. We had expected a third wave down to begin to develop some momentum, but another second wave correction has completed.
We still have two hourly wave counts for this daily chart. It is most likely that wave ii pink is over and that wave iii pink downwards has just begun. However, wave ii pink may yet continue higher and this is outlined in the alternate hourly chart below.
Wave ii pink, if it extends further as a double zigzag or double combination, may not move beyond the start of wave i pink. This wave count is invalidated with movement above 1,292.66.
If price does move above 1,292.66 this week then we may use our alternate wave count at the end of this analysis.
Targets remain the same. At 905.70 wave (3) black would reach 1.618 the length of wave (1) black. This mid term target is probably some weeks away.
At 450.14 primary wave 3 would reach equality with primary wave 1. This long term target is probably still a few months away.
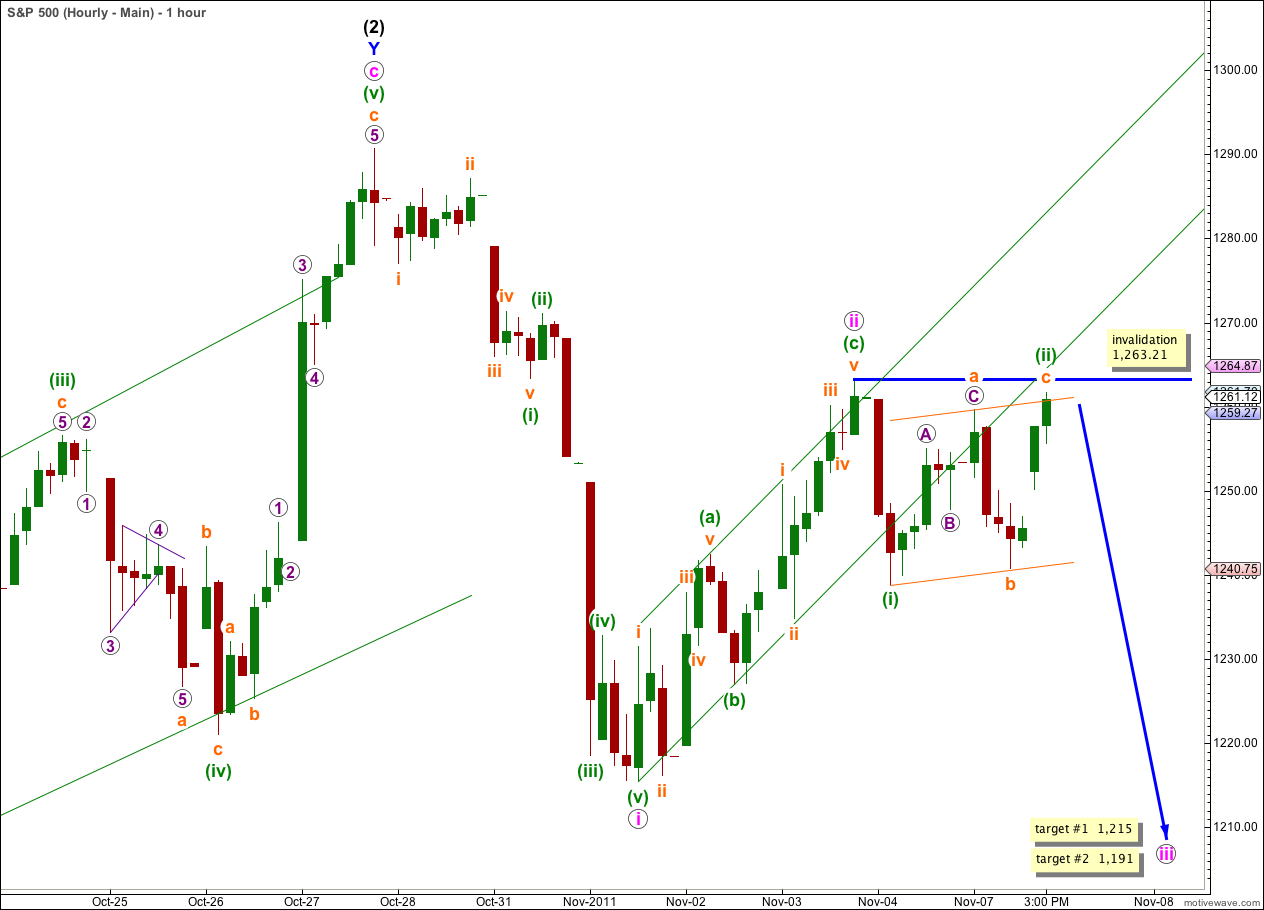
Wave (ii) green may have continued further as a regular flat correction. Wave b orange is a 91% correction of wave a orange, and wave c orange is just 0.25 points longer than equality with wave a orange.
On the 5 minute chart it is possible to see a complete structure for wave c orange and it may be over here. If it is not over it has almost no room to move higher. Wave (ii) green may not move beyond the start of wave (i) green. This wave count is invalidated with movement above 1,263.21.
At 1,215 wave iii pink would reach 1.618 the length of wave i pink. This remains our first target for downwards movement to end before a fourth wave correction unfolds.
If price moves through the first target and the structure requires further downwards movement to complete it then the next target is at 1,191 where wave iii pink would reach 2.618 the length of wave i pink.
Regular flat corrections lend themselves very well to parallel trend channels. Wave c orange has ended with a slight overshoot of the upper edge of the channel. When we can see movement below the channel we may use that as confirmation that wave (iii) green downwards is underway.
If price moves above 1,263.21 tomorrow then we may use the alternate wave count below.
Alternate Hourly Wave Count.

It remains possible that wave ii pink is incomplete and may yet move price higher.
If this is the case then it is unfolding as a double zigzag or double combination correction.
Wave (x) green is incomplete. At 1,237 wave c orange within wave (x) green would reach equality with wave a orange. Wave c orange may end about the lower edge of the small orange parallel channel containing the zigzag for wave (x) green.
Both our main hourly wave count and this alternate expect downwards movement tomorrow.
Alternate Wave Count.
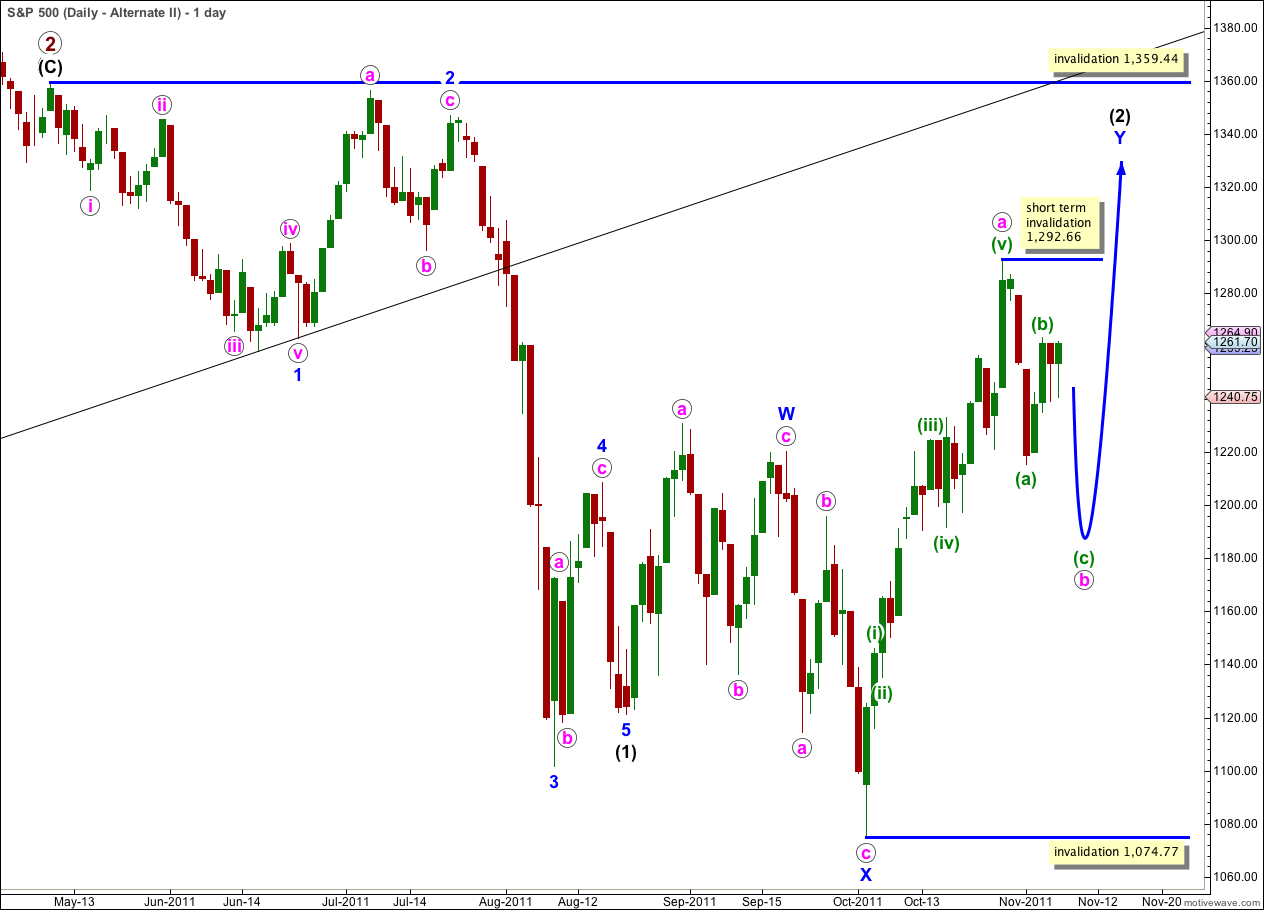
If we can see the last long upwards wave (labeled here as a pink) as a five wave structure, then a zigzag for wave Y blue may be incomplete.
Wave Y blue is now starting to look out of proportion to wave W blue, but apart from that concern this wave count fits.
Wave b pink may not move beyond the start of wave a pink. This wave count is invalidated with movement below 1,074.77. Unfortunately this is the price point which differentiates this alternate from our main wave count, and we may only have full confidence that wave (3) black is underway when price makes a new low.
In the short term within wave b pink wave (b) green may not move beyond the start of wave (a) green. This wave count is invalidated with movement above 1,292.66 in the short term.
Both this alternate and our main wave count have the same invalidation point (at least in the short term) and the same expectation of downwards movement this week.
Thereafter, this alternate would expect price to move back into wave (a) green price territory as wave c pink moves up to make a new high, and our main wave count would expect price to then remain below that point.
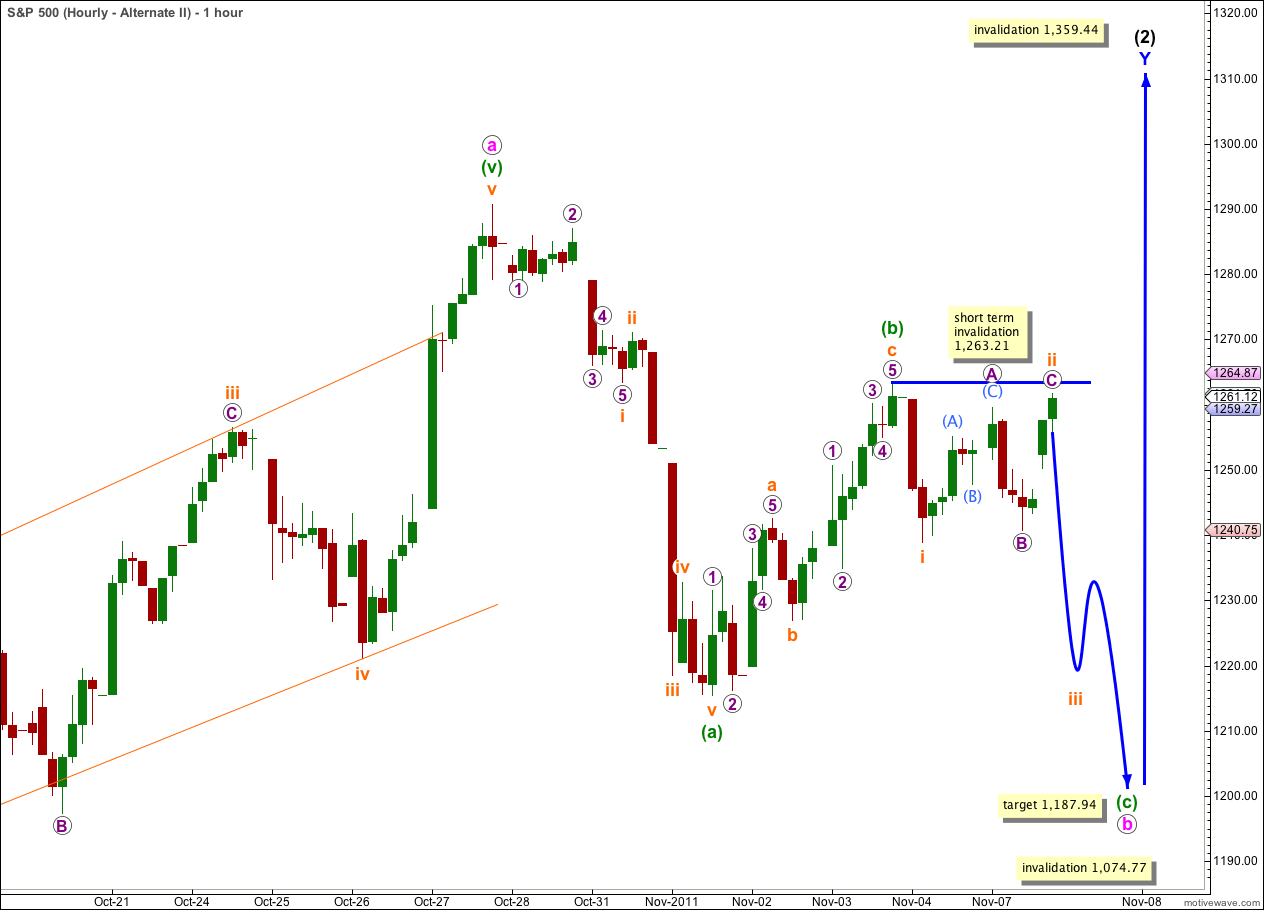
Wave (c) green to complete the zigzag for wave b pink must subdivide into a five wave structure. Wave i orange looks most like a five wave leading diagonal on the 5 minute chart, and wave (c) green may be unfolding as a simple impulse.
Wave (c) green is extremely likely to make a new low below the low labeled (a) green at 1,215.42 to avoid a truncation.
At 1,187.94 wave (c) green would reach equality in length with wave (a) green.
When wave (c) green is a complete five wave structure then this wave count expects price to make a new high above 1,292.66. At that point this alternate wave count diverges from our main wave count which would expect price to remain below 1,215.42 with increasing downwards momentum.
In the short term wave ii orange may not move beyond the start of wave i orange. This wave count is invalidated with movement above 1,263.21.