
Elliott Wave chart analysis for the S&P 500 for 4th November, 2011. Please click on the charts below to enlarge.
Last analysis expected downwards movement, and we did get some, followed by another second wave correction upwards of a smaller degree.
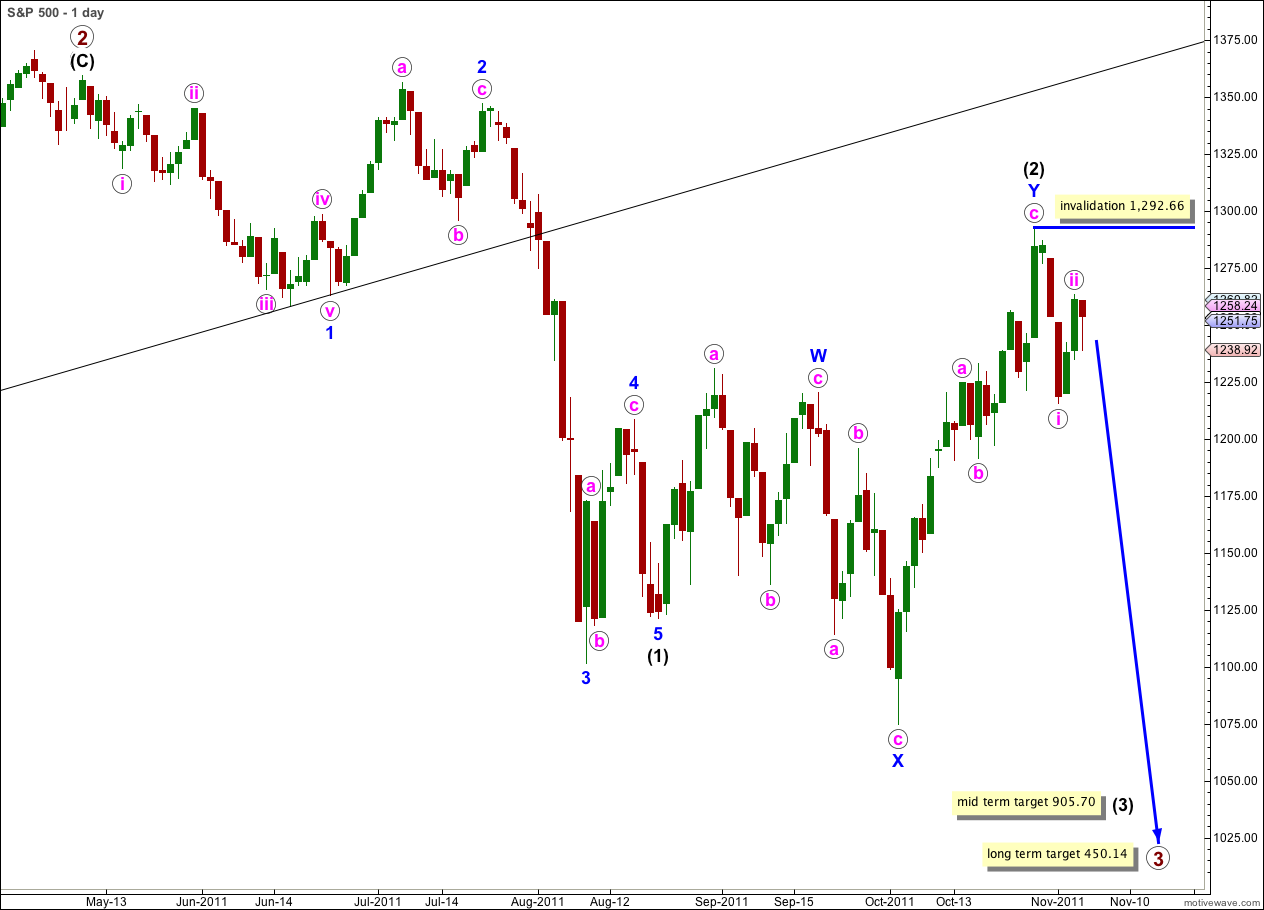
We now have a series of overlapping first and second waves: primary 1-2, intermediate (black) (1) – (2), and within blue wave 1 pink (minute) i and ii. When pink wave iii is further underway we should see an increase in downwards momentum.
Wave ii pink, if it extends further as a double zigzag or double combination, may not move beyond the start of wave i pink. This wave count is invalidated with movement above 1,292.66.
If price does move above 1,292.66 next week then we may use our alternate wave count at the end of this analysis.
Wave ii pink is a complete zigzag structure. A parallel channel containing this zigzag has a small channel breach, but it is less than completely convincing. For this reason I have an alternate hourly wave chart for you below.
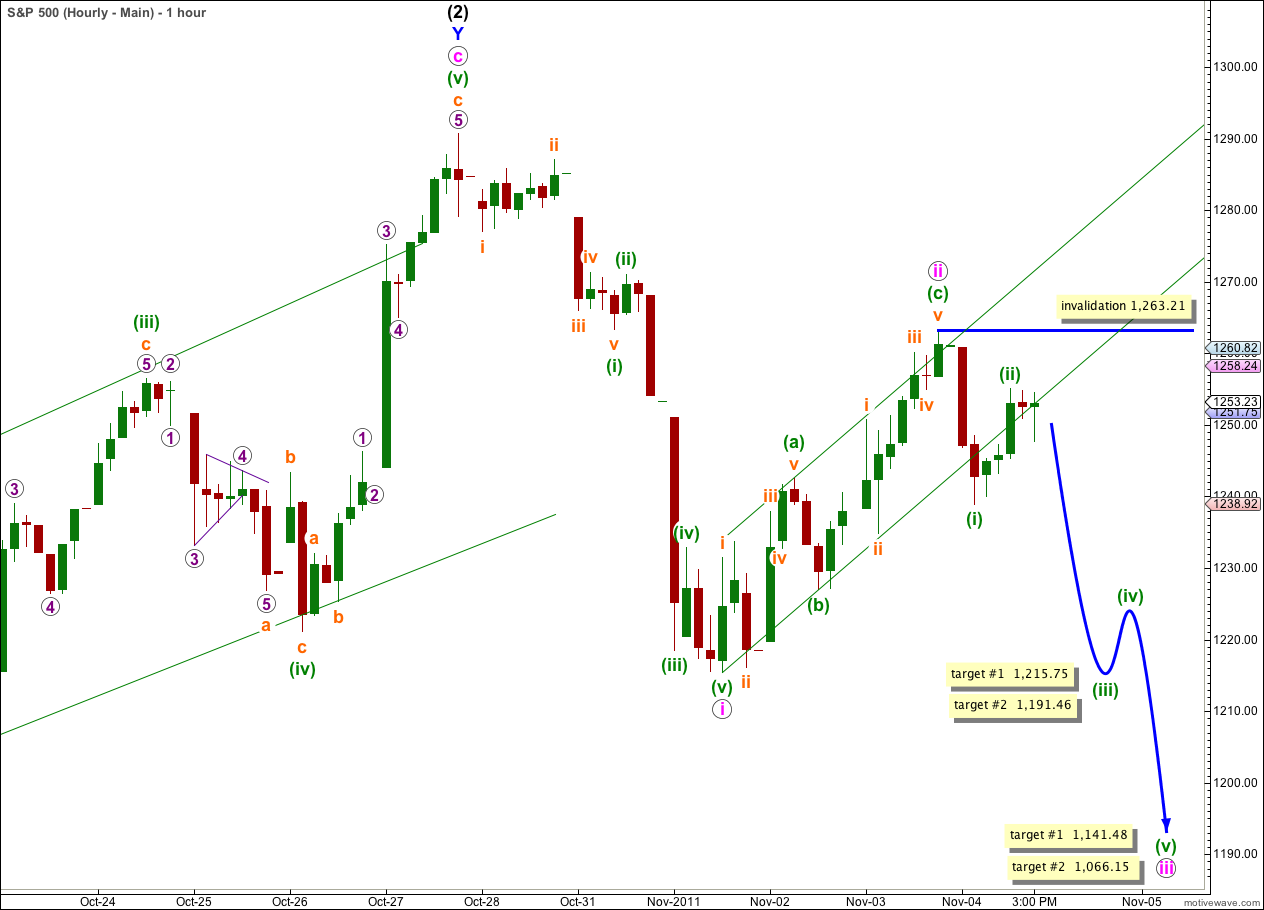
Wave (ii) green looks like a complete zigzag structure on the 5 minute chart, ending with an overshoot of the 0.618 Fibonacci ratio of wave (i) green. It is highly likely that it was over at 1,255.05. On the 5 minute chart this is followed by a five wave structure downwards, a leading diagonal, and another deep second wave correction which we would expect to see following a leading diagonal in a second wave position.
This is likely to be followed by an extended third wave.
At 1,215.75 wave (iii) green would reach 1.618 the length of wave (i) green. If price moves strongly through this first target without any significant corrections then the next Fibonacci ratio in the sequence is 2.618 the length of wave (i) green at 1,191.46. These short term targets may be reached within another one to two trading days.
Targets for wave iii pink remain the same. At 1,141.48 wave iii pink would reach 1.618 the length of wave i pink. At 1,066.15 wave iii pink would reach 2.618 the length of wave i pink. These targets may be about a week away.
If wave ii pink is complete then within wave iii pink wave (ii) green may not move beyond the start of wave (i) green. This wave count is invalidated with movement above 1,263.21.
This wave count has a better overall look than the alternate hourly chart below. Wave ii pink, if it is complete, lasted 18 hours and wave i pink lasted 22 hours. They look nicely in proportion.
Alternate Hourly Chart.
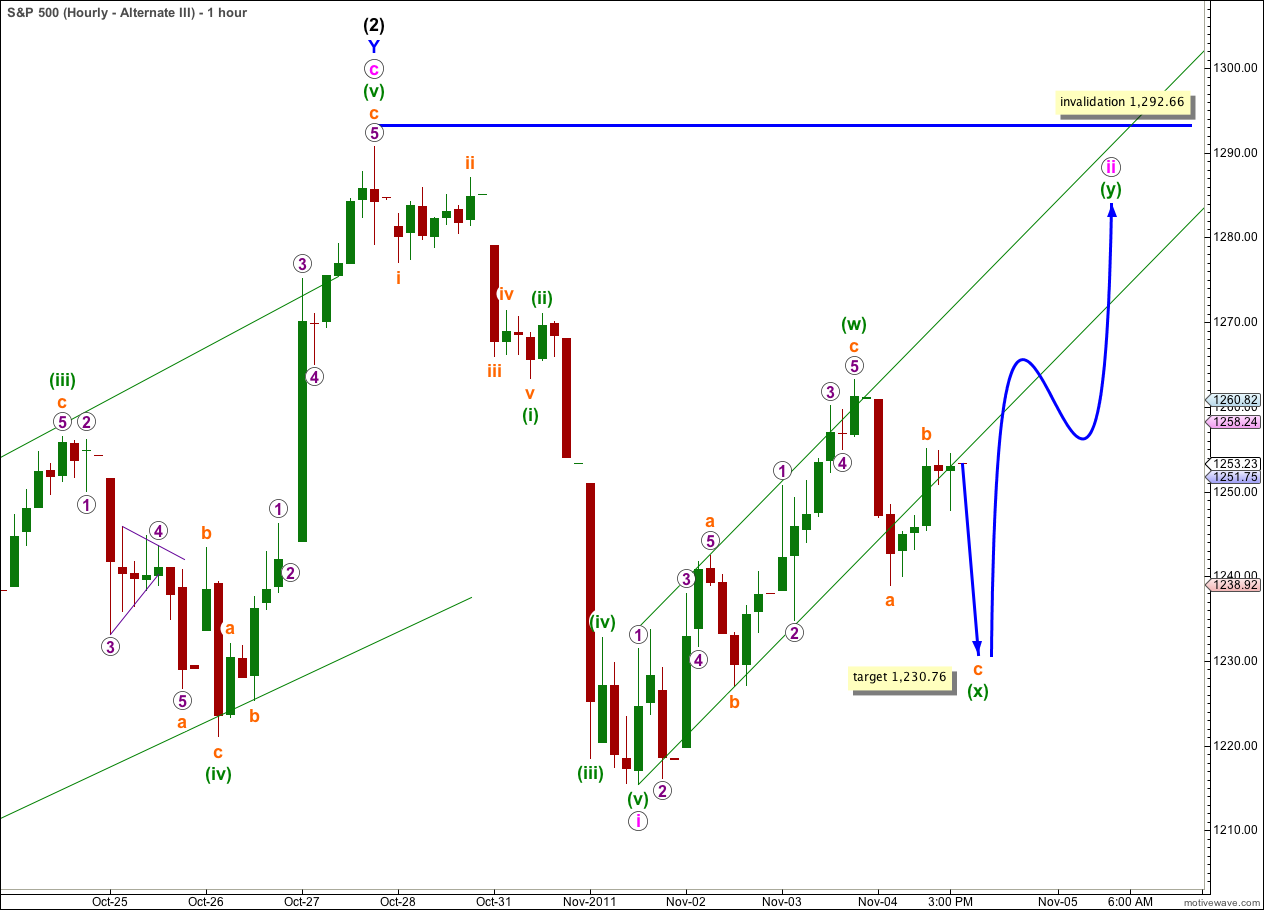
It is possible that wave ii pink is incomplete and may continue further as a double zigzag, double combination or a flat correction.
The complete zigzag upwards labeled (w) green is the first zigzag in a double, joined by a zigzag in the opposite direction labeled (x) green which is incomplete.
If price moves above 1,263.21 then wave ii pink is continuing. It may not move beyond the start of wave i pink. This wave count is invalidated with movement above 1,292.66.
Both the first hourly chart and this one expect further downwards movement when markets open on Monday. If after the next wave down price remains below the low labeled a orange at 1,238.92 then we may favour the first hourly chart over this one. If price completes another wave downwards then moves back above 1,238.92 then we may favour this alternate hourly chart.
Alternate Wave Count.
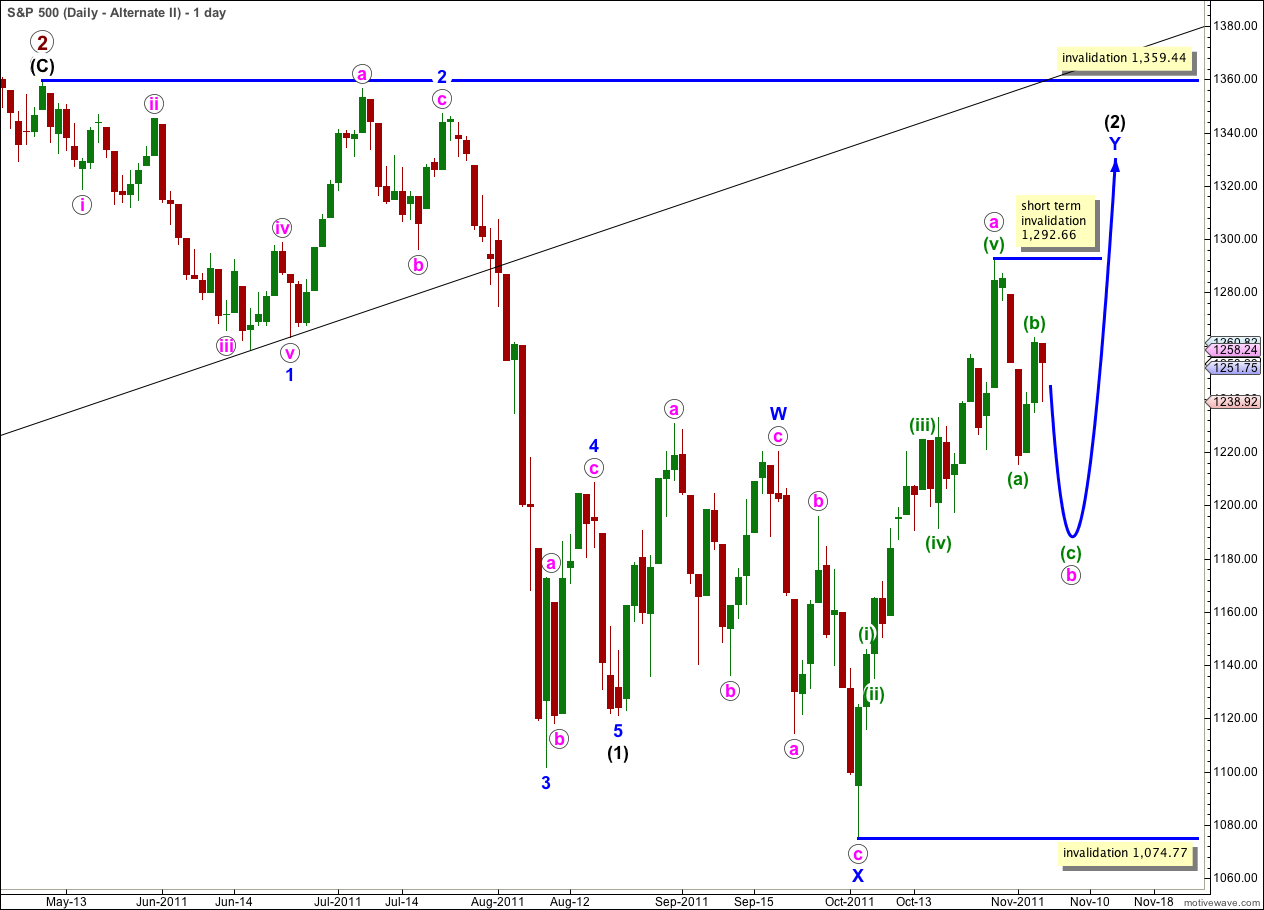
If we can see the last long upwards wave (labeled here as a pink) as a five wave structure, then a zigzag for wave Y blue may be incomplete.
Wave Y blue is now starting to look out of proportion to wave W blue, but apart from that concern this wave count fits.
Wave b pink may not move beyond the start of wave a pink. This wave count is invalidated with movement below 1,074.77. Unfortunately this is the price point which differentiates this alternate from our main wave count, and we may only have full confidence that wave (3) black is underway when price makes a new low.
In the short term within wave b pink wave (b) green may not move beyond the start of wave (a) green. This wave count is invalidated with movement above 1,292.66 in the short term.
Both this alternate and our main wave count have the same invalidation point (at least in the short term) and the same expectation of downwards movement next week.
Thereafter, this alternate would expect price to move back into wave (a) green price territory as wave c pink moves up to make a new high, and our main wave count would expect price to then remain below that point.
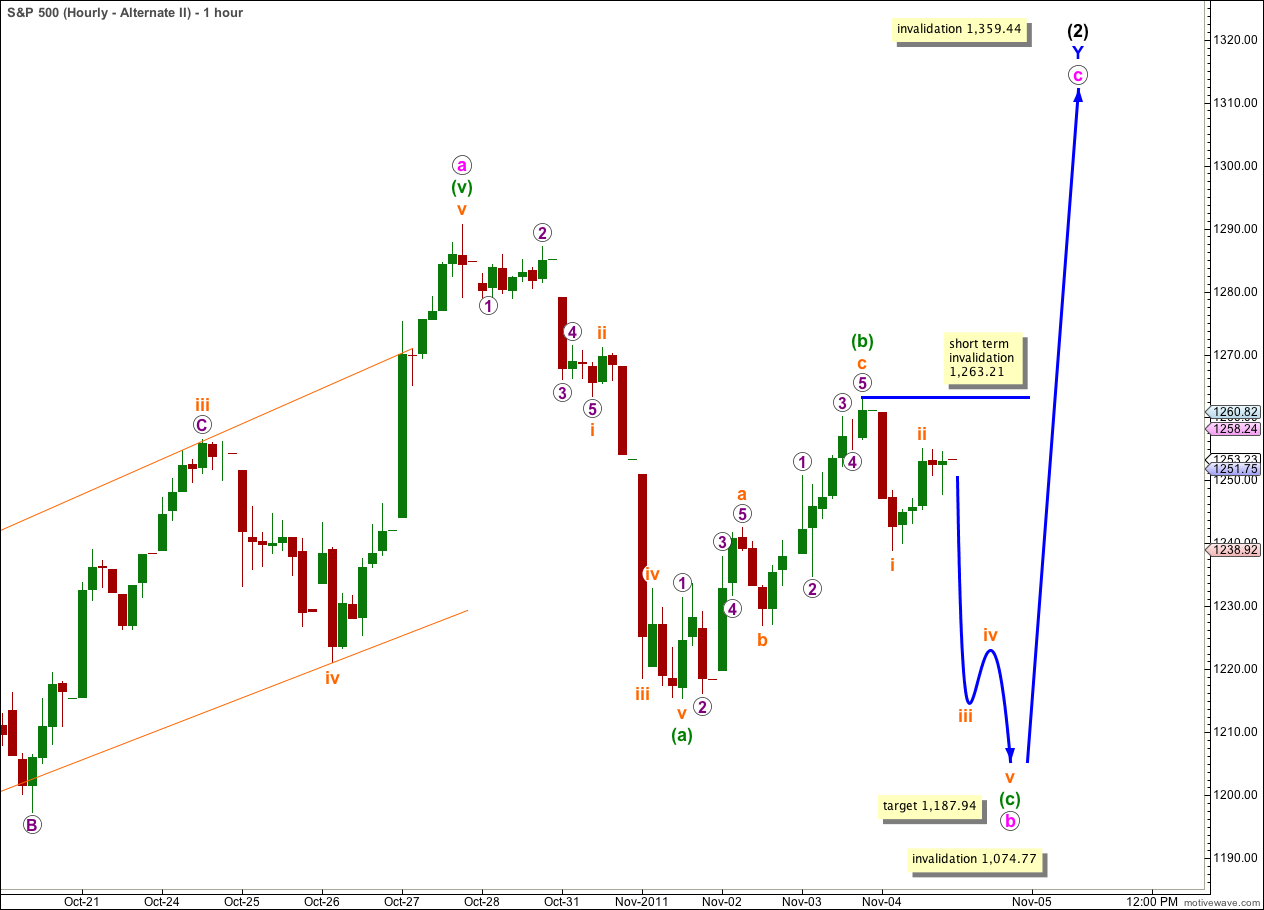
Wave (c) green to complete the zigzag for wave b pink must subdivide into a five wave structure. Wave i orange looks most like a five wave leading diagonal on the 5 minute chart, and wave (c) green may be unfolding as a simple impulse rather than an ending diagonal.
Wave (c) green is extremely likely to make a new low below the low labeled (a) green at 1,215.42 to avoid a truncation.
At 1,187.94 wave (c) green would reach equality in length with wave (a) green.
When wave (c) green is a complete five wave structure then this wave count expects price to make a new high above 1,292.66. At that point this alternate wave count diverges from our main wave count which would expect price to remain below 1,215.42 with increasing downwards momentum.
In the short term wave ii orange may not move beyond the start of wave i orange. This wave count is invalidated with movement above 1,263.21.