
Elliott Wave chart analysis for the S&P 500 for 3rd November, 2011. Please click on the charts below to enlarge.
Price has moved higher, and we did have an alternate wave count which allowed for this, but we were not expecting a deep second wave correction within a third wave of a third wave of a third wave. The last two days strong upwards movement is placing doubt on this main wave count.
For this reason I have an alternate below for you today.
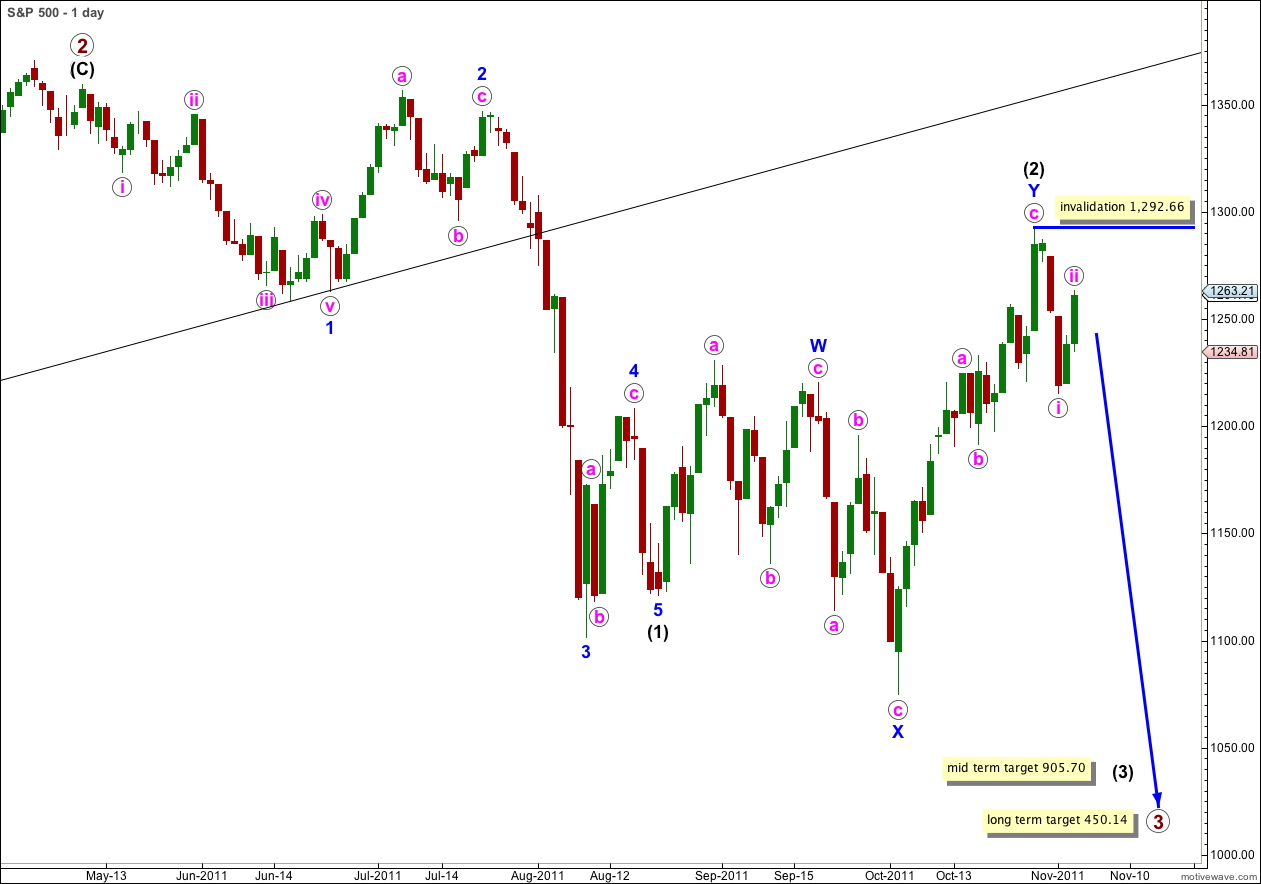
This wave count does remain valid however, and will do while price does not move above 1,290.69.
Looking back at black wave (3) within primary wave 1 within cycle wave c (the “credit crunch”) we can see the first correction was just less than 50% and lasted 3 days, but the next second wave correction was over 90% and lasted 2 days. I don’t want the mantra “corrections should be brief and shallow because this is a third wave” to be taken as law. They don’t have to be.
We are still only within blue wave 1 of wave 3 black. It may not be until we get towards the middle, blue wave 3, that the drop is sheer. If we were seeing a deep correction in that position I would be very concerned about the wave count. Today I have some doubts, but not serious concern.
Wave ii pink may not move beyond the start of wave i pink. This wave count is invalidated with movement above 1,292.66.
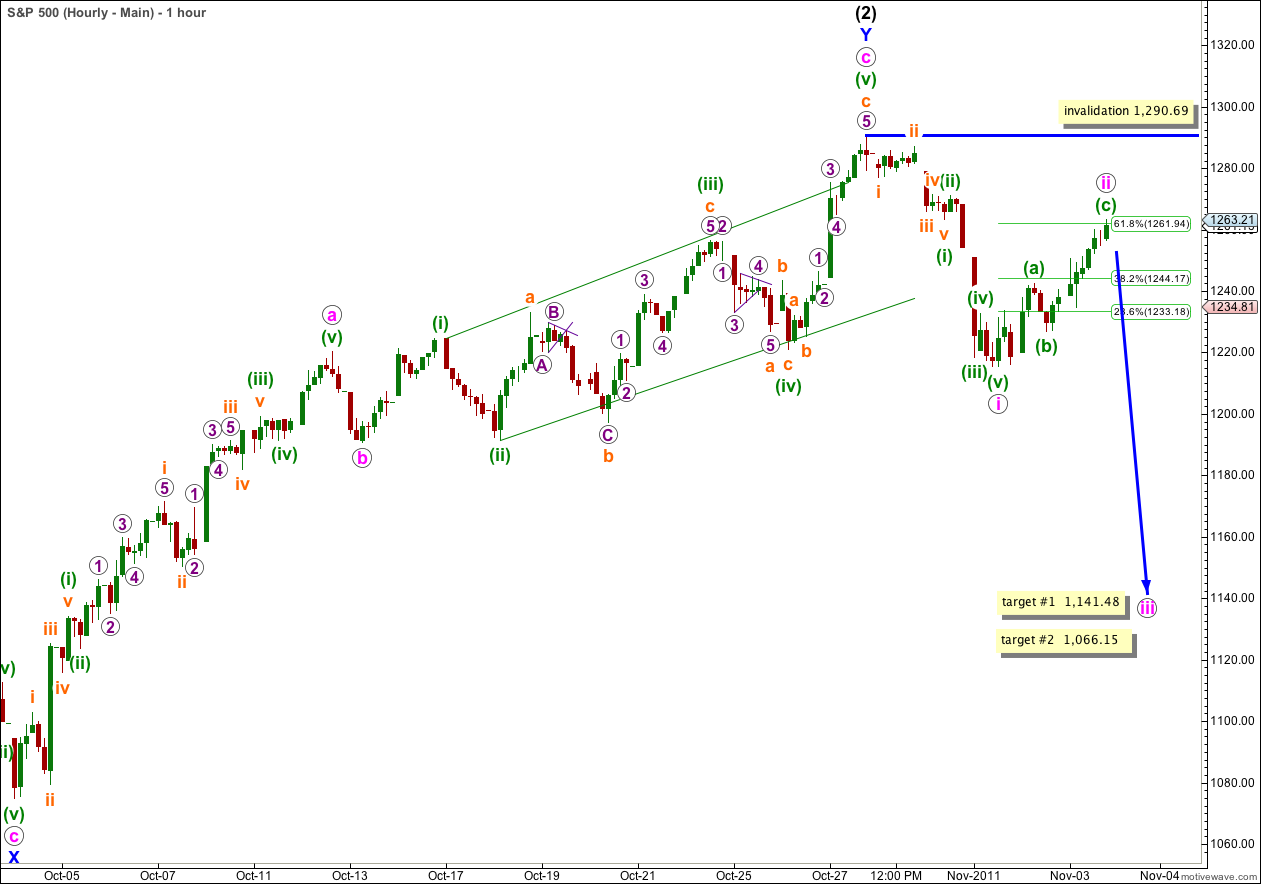
What does look reasonably obvious on the hourly chart is that upwards movement looks corrective compared to prior downwards movement. We saw a sheer drop down for wave (iii) green within i pink and wave ii pink does not have similar movement as the candlesticks look smaller and choppier.
I have adjusted the wave count within wave Y blue. This has a better fit, the ratios are great, it removes the problem I had of a lack of alternation, and resolves the problem I had with the ending diagonal of wave c pink.
Ratios within wave a pink of wave Y blue are: wave (iii) green has no Fibonacci ratio to wave (i) green, and wave (v) green is just 0.52 points short of 0.382 the length of wave (iii) green.
Ratios within wave (i) green of wave a pink are: wave iii orange is just 0.2 points longer than 1.618 the length of wave i orange, and wave v orange is 1.06 points longer than 0.618 the length of wave i orange.
Ratios within wave (iii) green of wave a pink are: wave iii orange has no Fibonacci ratio to wave i orange, and wave v orange is 0.94 points short of 0.382 the length of wave i orange.
Within wave a pink wave (ii) green is a zigzag and wave (iv) green is a flat correction. This gives nice alternation.
Wave c pink is an ending expanding diagonal where wave (iv) green is longer than wave (ii) green, wave (iii) green is longer than wave (i) green, and wave (v) green is longer than wave (iii) green. This is a much better fit than the hourly chart from yesterday.
The double flat or double combination for wave ii pink does not fit at all. Another look on the 5 minute chart sees wave (a) green may have ended as a five wave impulse and wave ii pink may be a simple zigzag structure.
Within wave ii pink wave (c) green has no Fibonacci ratio to wave (a) green. On the 5 minute chart wave (c) green is now a complete five wave structure, and with wave ii pink slightly overshooting the 0.618 Fibonacci ratio of wave i pink it would be very likely to be over here. If wave (c) green does extend any higher then a possible target may be at 1,270.75 where it would reach 1.618 the length of wave (a) green.
At 1,141.48 wave iii pink would reach 1.618 the length of wave i pink. At 1,066.15 wave iii pink would reach 2.618 the length of wave i pink.
Wave ii pink may not move beyond the start of wave i pink. This wave count is invalidated with movement above 1.290.69.
If this wave count is correct then we should see a third wave down tomorrow.
Alternate Wave Count.
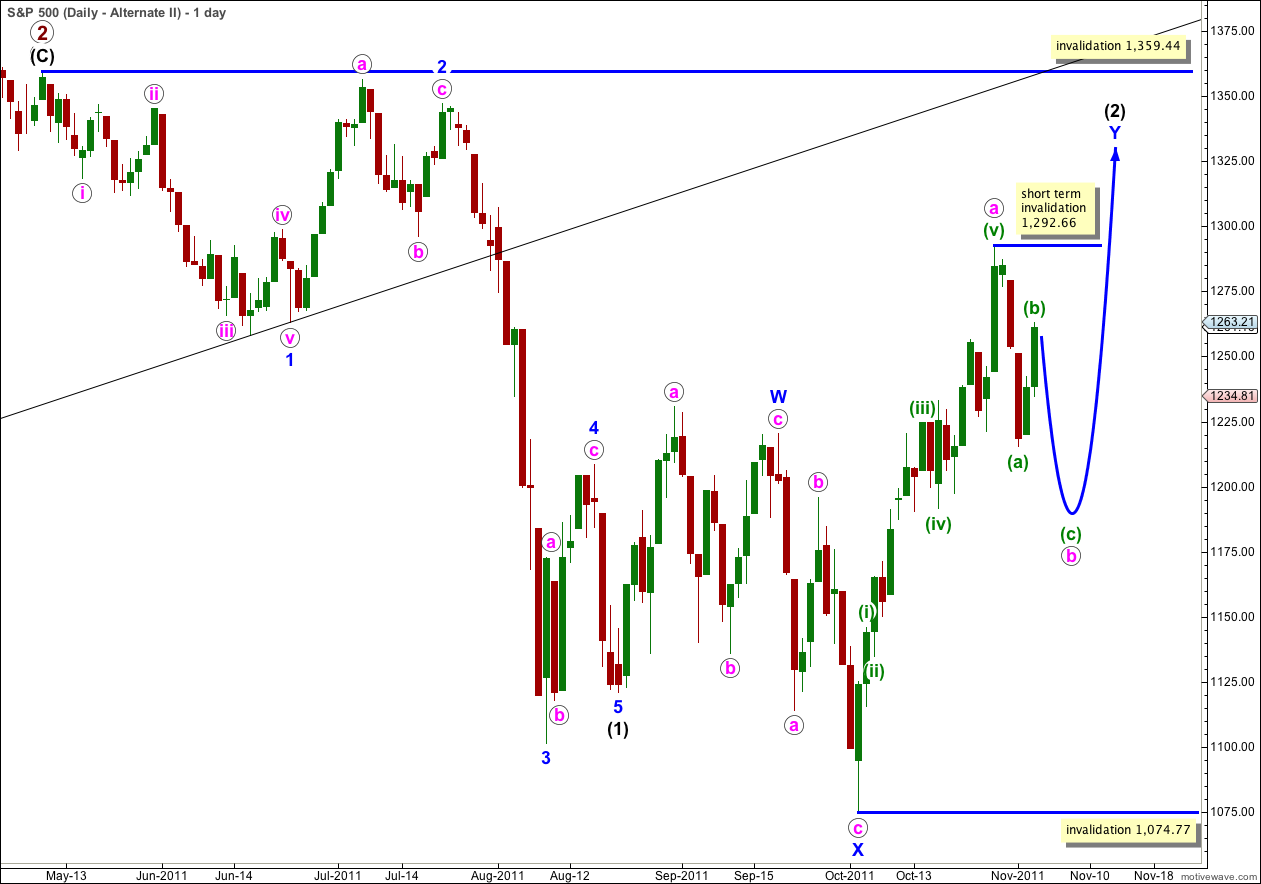
If we can see the last long upwards wave (labeled here as a pink) as a five wave structure, then a zigzag for wave Y blue may be incomplete.
Wave Y blue is now starting to look out of proportion to wave W blue, but apart from that concern this wave count fits.
Wave b pink may not move beyond the start of wave a pink. This wave count is invalidated with movement below 1,074.77. Unfortunately this is the price point which differentiates this alternate from our main wave count, and we may only have full confidence that wave (3) black is underway when price makes a new low.
In the short term within wave b pink wave (b) green may not move beyond the start of wave (a) green. This wave count is invalidated with movement above 1,292.66 in the short term.
Both this alternate and our main wave count have the same invalidation point (at least in the short term) and the same expectation of downwards movement tomorrow.
Thereafter, this alternate would expect price to move back into wave (a) green price territory as wave c pink moves up to make a new high, and our main wave count would expect price to then remain below that point.
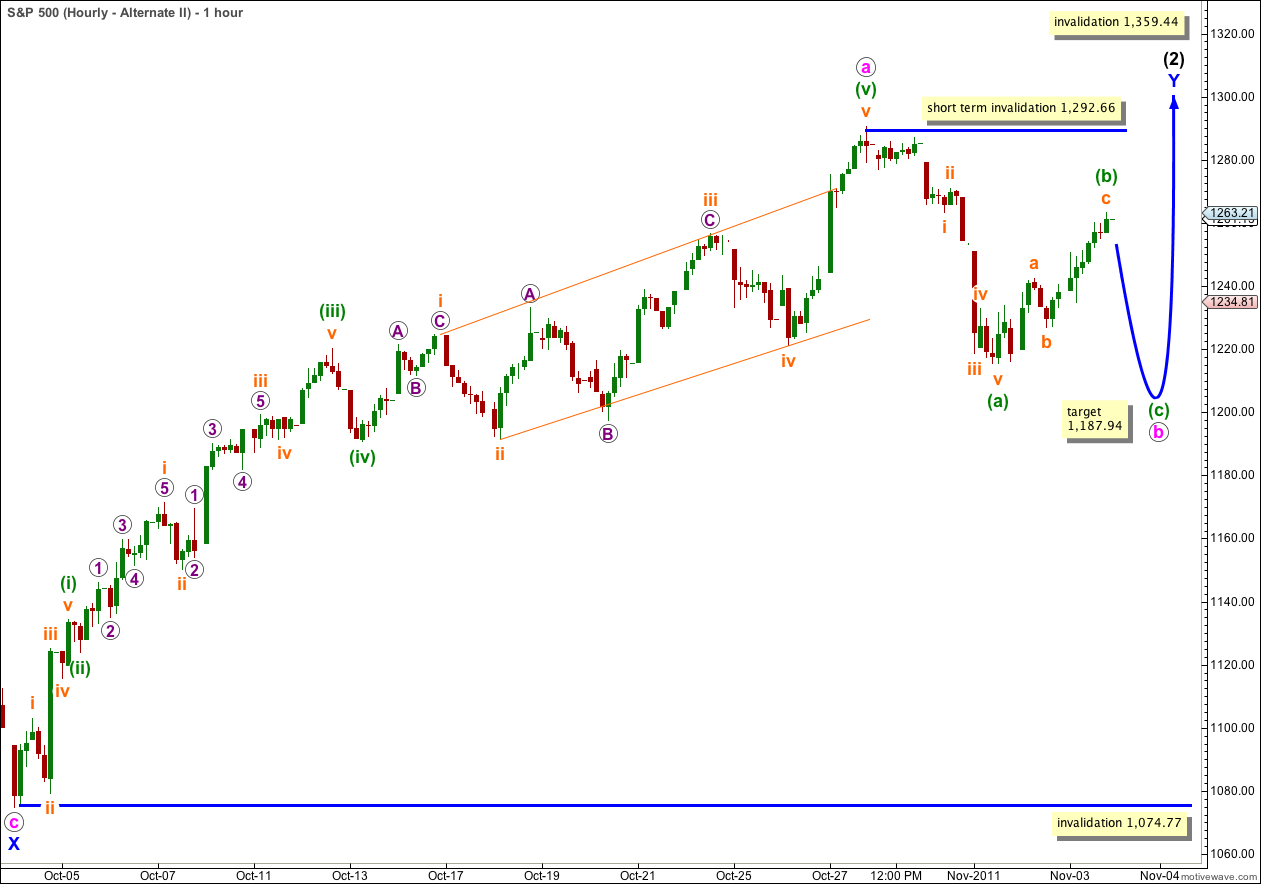
This alternate hourly wave count sees recent upwards movement as a five wave structure. The difference between this and the main hourly wave count is very small and subtle; it is wave 4 purple within wave iii orange of wave (iii) green. This alternate may be considered to have a very slightly better fit here than the main hourly wave count.
At 1,187.94 wave (c) green would reach equality with wave (a) green within wave b pink. Thereafter, for this wave count price should move upwards to make a new high.