
Elliott Wave chart analysis for the S&P 500 for 1st November, 2011. Please click on the charts below to enlarge.
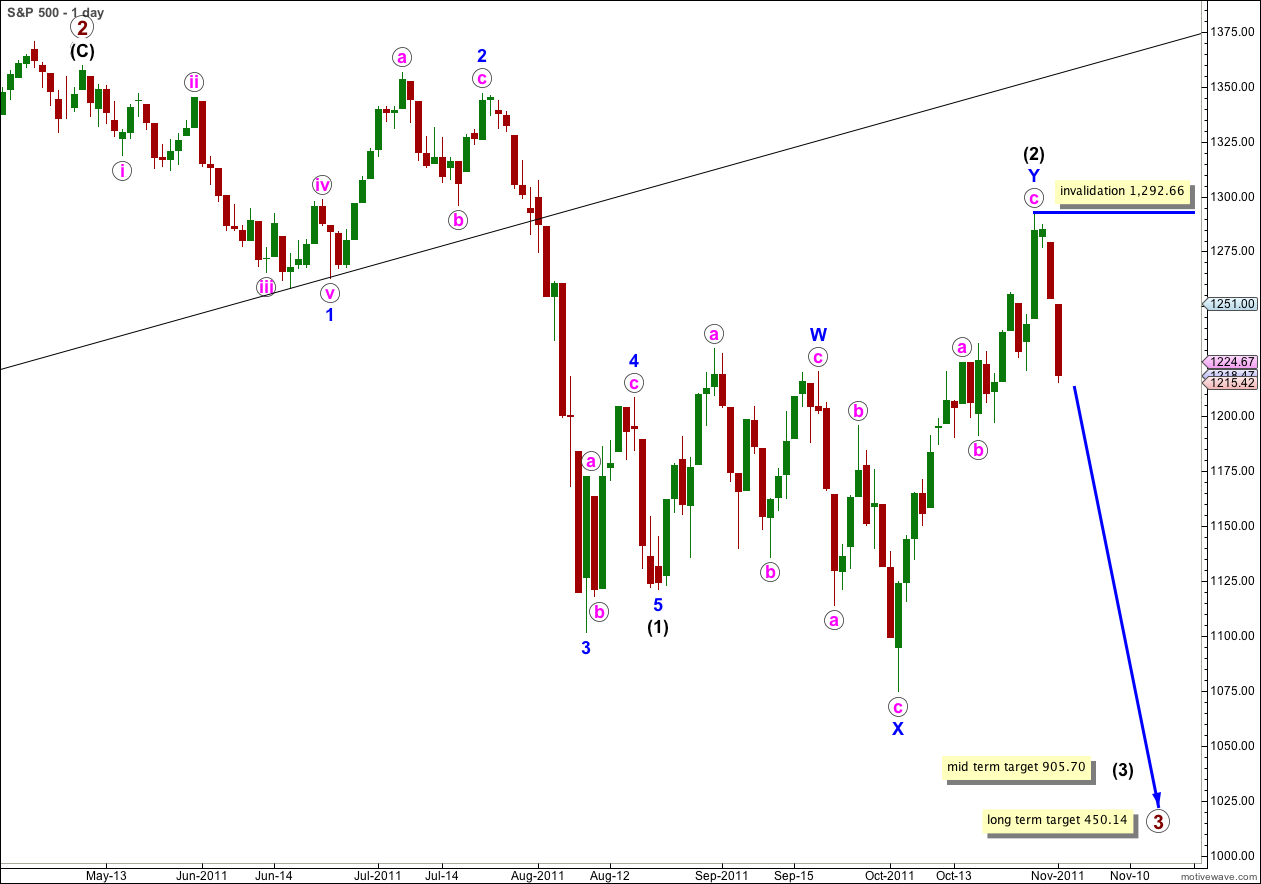
Movement below 1,221.06 has invalidated our main wave count and confirmed the alternate, thereby confirming a trend change for the S&P 500.
Wave (2) black is a complete double zigzag structure.
There is a very small possibility that wave (2) black could continue yet higher as a triple zigzag, but the rarity of these structures makes this possibility highly unlikely. Wave (2) black is already a deep correction of wave (1) black, overshooting the 0.618 Fibonacci ratio.
With the last two strong downwards days from the S&P it is highly likely that wave (3) black is now underway.
At 905.70 wave (3) black would reach 1.618 the length of wave (1) black. This is our first target for it to end, and this target is probably two to three weeks away.
If price moves through this first target then the next expectation would be at 2.618 the length of wave (1) black at 666.54. There is a lot of resistance about this area as that is close to where primary wave 1 ended.
The long term target remains the same. Primary wave 3 will reach equality with primary wave 1 at 450.14. This target is still months away.
Our alternate historic wave count sees downwards movement unfolding as a corrective structure which is likely to make a new low below 666.79 but does not have to. We would still be within primary wave A within this cycle degree correction.
At this stage within black wave (3) no second wave correction may move beyond the start of its first wave. This wave count is invalidated with movement above 1,292.66.
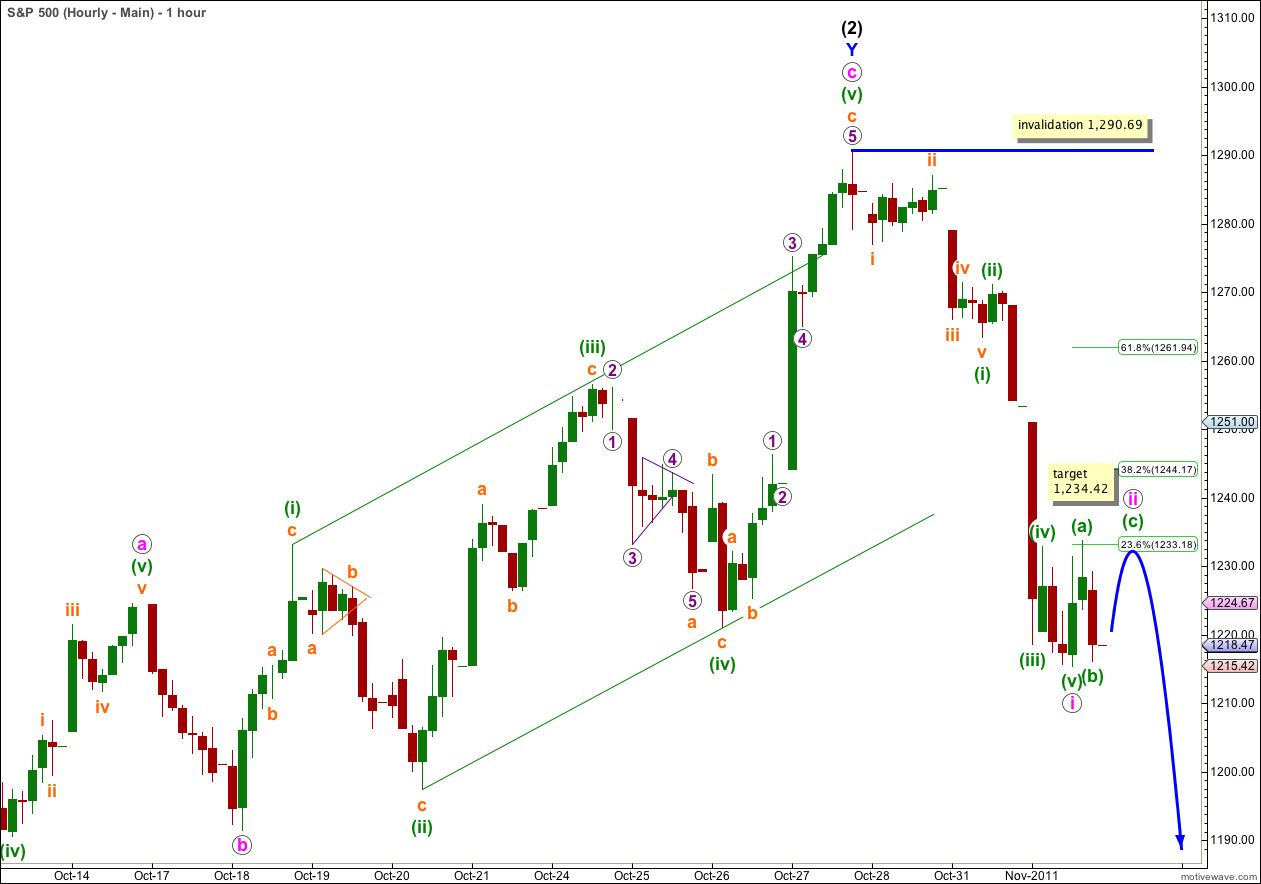
Downwards movement is in a five wave structure which adds further confidence to a trend change.
Ratios within wave i pink are: wave (iii) green has no Fibonacci ratio to wave (i) green, and wave (v) green is just 0.51 points longer than 0.618 the length of wave (i) green.
Ratios within wave (i) green are: wave iii orange is 1.03 points short of 1.618 the length of wave i orange, and wave v orange is just 0.48 points short of 0.618 the length of wave i orange.
Wave ii pink looks like a regular flat correction on the 5 minute chart. Wave (b) green is a 96% correction of wave (a) green, and wave (c) green would reach equality with wave (a) green at 1,234.42.
It is possible that wave ii pink was over at the high labeled wave (a) green within wave ii pink, as that is a complete zigzag structure on the hourly chart, but it would look more in proportion to wave i pink if it continued a little further.
Wave ii pink may not move beyond the start of wave i pink. This wave count is invalidated with movement above 1,290.69.
If this wave count is correct then we should expect further downwards movement with an increase in momentum over the next one to three weeks.
Alternate Daily Wave Count.
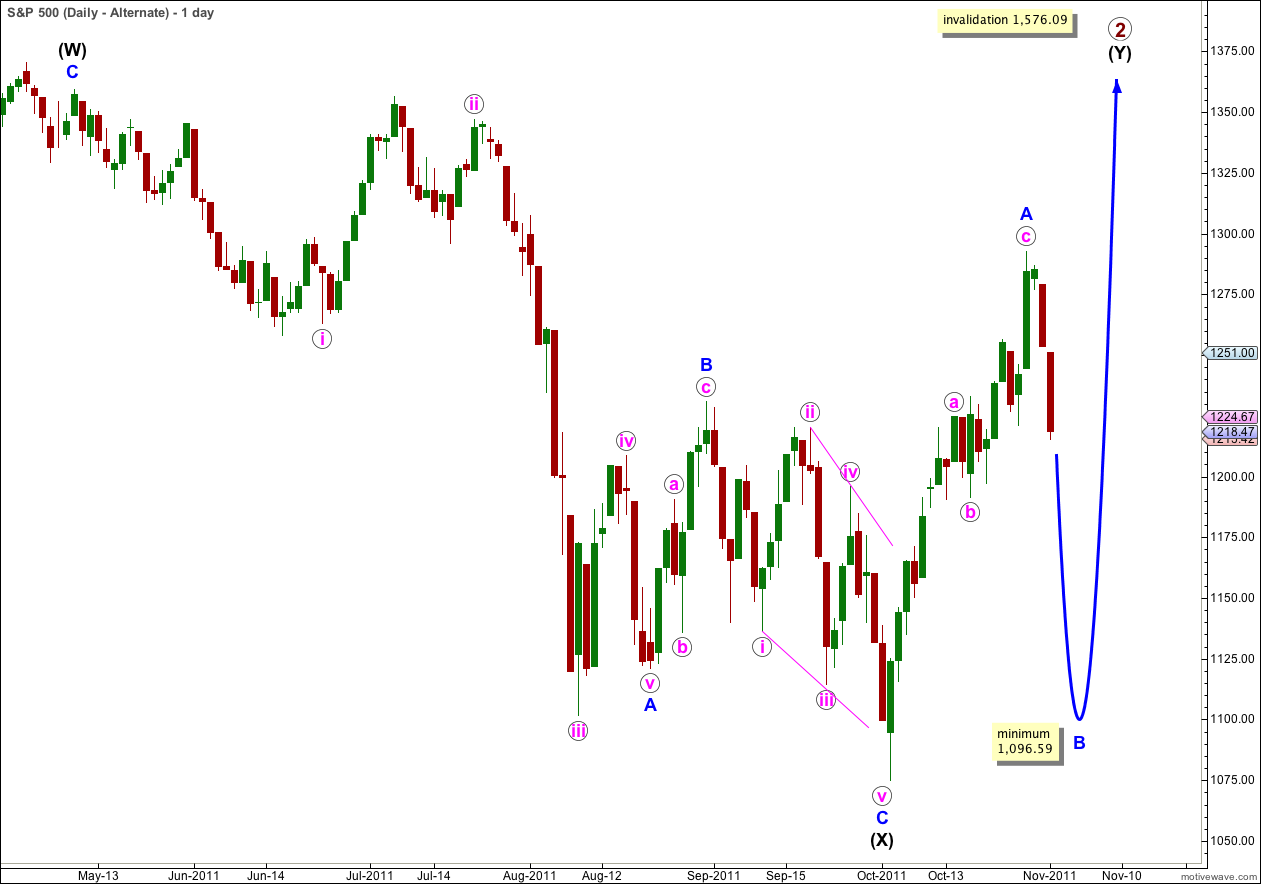
I am presenting this wave count mostly in response to members’ queries. This is the only scenario I can see in which price could move above 1,359.44 (or above 1,370.58).
This wave count sees primary wave 2 as incomplete and continuing further as a double combination correction. Wave (W) black, the first structure in the double, is a complete zigzag. The double is joined by a zigzag in the opposite direction labeled (X) black. Wave (Y) black would most likely be a flat correction as wave A blue has subdivided into a three (or this may be only wave a pink of wave A blue which would be a three wave flat).
There are a few problems with this wave count. The main problem is the structure of wave C blue within wave (X) black: this ending diagonal has imperfect wave lengths (iv is shorter than ii, but v is longer than iii which is longer than i) and the subdivisions of iii and v are not clearly zigzags.
Another problem is one of proportionality. Primary wave 2 is already a 72% correction of primary wave 1, and lasted 9 months longer than primary wave 1. Seeing it continue higher and for longer would put it out of proportion to primary wave 1 and this reduces the probability of this wave count.
Finally, this wave count just does not have the right look on the weekly or monthly chart.
This wave count is technically possible, but it has a very low probability. I will only publish and consider it again if our main wave count is invalidated by upwards movement.