
Elliott Wave chart analysis for the S&P 500 for 31st October, 2011. Please click on the charts below to enlarge.
Movement below 1,256.55 has invalidated our hourly wave count. Wave c pink cannot be a simple impulse and must be an ending diagonal, which is either over or needs yet further upwards movement. I have two hourly wave counts for you today.
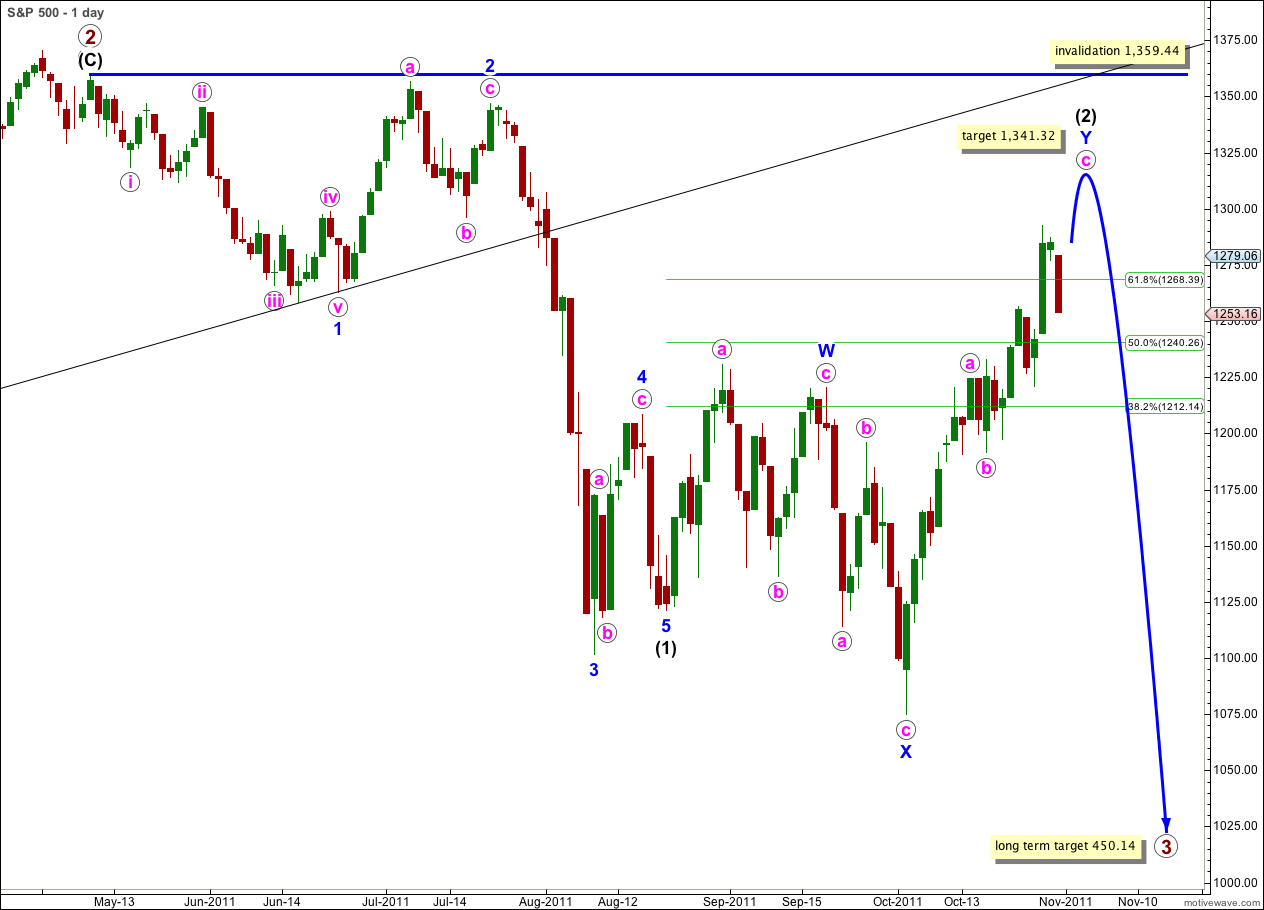
We should always assume that the trend remains the same, until proved otherwise. We should assume at this stage that the trend is upwards. Movement below 1,221.06 would indicate a trend change.
Wave c pink would reach equality with wave a pink at 1,341.32. This is our target for wave (2) black to end.
Wave (2) black may not move beyond the start of wave (1) black. This wave count is invalidated with movement above 1,359.44.
Main Hourly Wave Count.
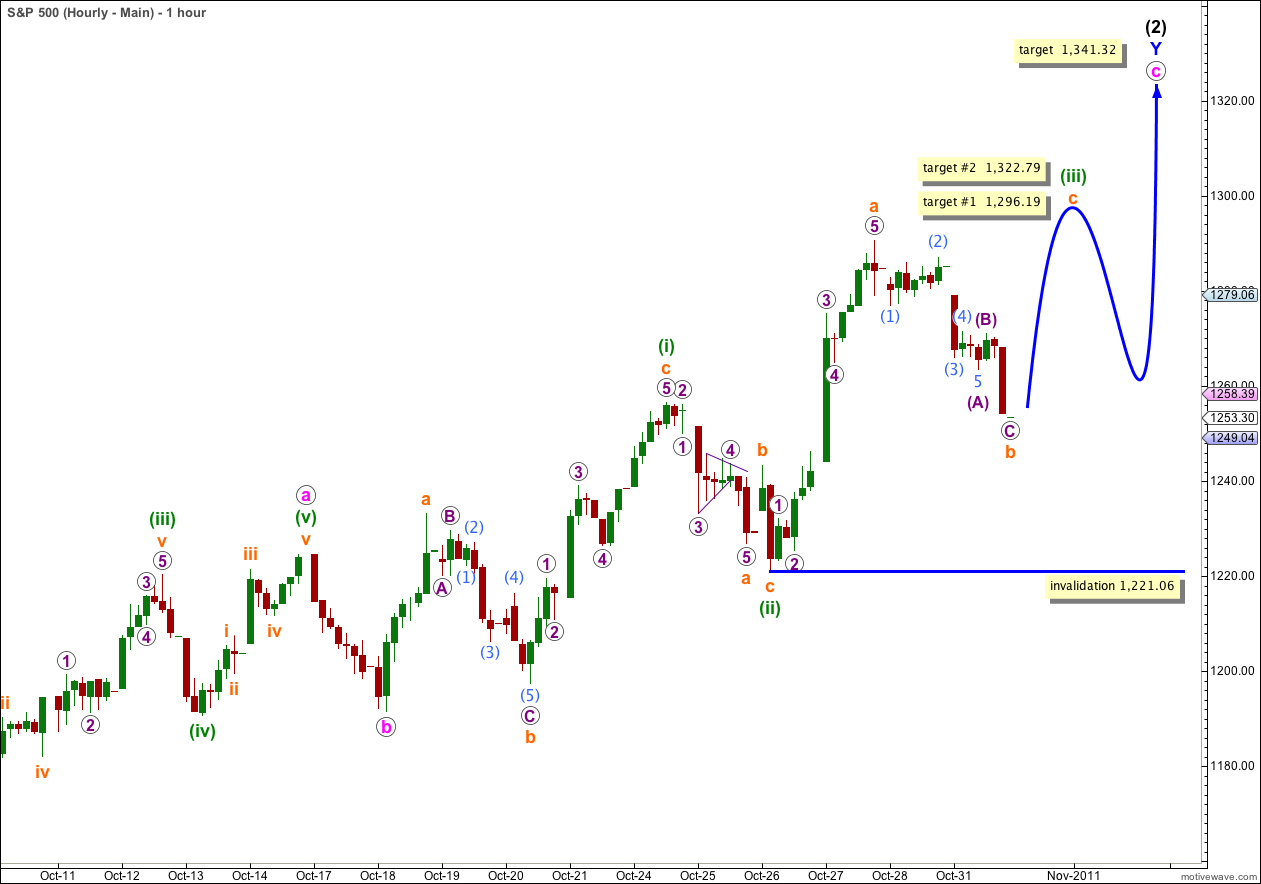
Wave c pink may be unfolding as an ending diagonal, with only waves (i) and (ii) green complete.
For an ending diagonal all subwaves must subdivide into zigzags, and they are usually pretty obviously zigzags. This wave count has a higher probability than the alternate below. I have checked all the subdivisions for wave c pink on the 5 minute chart and this main hourly wave count has a slightly better fit than the alternate, particularly within wave (i) green.
Within wave (i) green there is no Fibonacci ratio between waves a and c orange.
Ratios within wave c orange of wave (i) green are: wave 3 purple has no Fibonacci ratio to wave 1 purple, and wave 5 purple is 2.1 points longer than equality with wave 3 purple.
Within wave (ii) green there is no Fibonacci ratio between waves a and c orange.
Ratios within wave a orange of wave (iii) green are: wave 3 purple is 3.24 points longer than 4.236 the length of wave 1 purple, and wave 5 purple has no Fibonacci ratio to either of 1 or 3 purple.
Within the zigzag for wave (iii) green wave b orange looks to be now complete on the 5 minute chart.
Within wave b orange wave C purple is 1.02 points longer than 0.618 the length of wave A purple.
Ratios within wave A purple of wave b orange within wave (iii) green are: wave (3) aqua is 1.03 points short of 1.618 the length of wave (1) aqua, and wave (5) aqua is just 0.48 points short of 0.618 the length of wave (1) aqua.
Within wave (iii) green zigzag wave c orange would reach 0.618 the length of wave a orange at 1,296.19. This is the first possible target for short term upwards movement to end.
At 1,322.79 wave c orange would reach equality with wave a orange in length. This is the second possible target for upwards movement to complete wave (iii) green.
When wave (iii) green is complete then this wave count expects a zigzag downwards for wave (iv) green which should overlap wave (i) green price territory below 1,256.55 but may not move beyond the end of wave (ii) green below 1,221.06.
Thereafter, a final upwards zigzag towards the target at 1,341.32 would complete the ending diagonal structure.
If price moves below 1,221.06 before this structure is complete then we may use the alternate wave count below.
Alternate Hourly Wave Count.
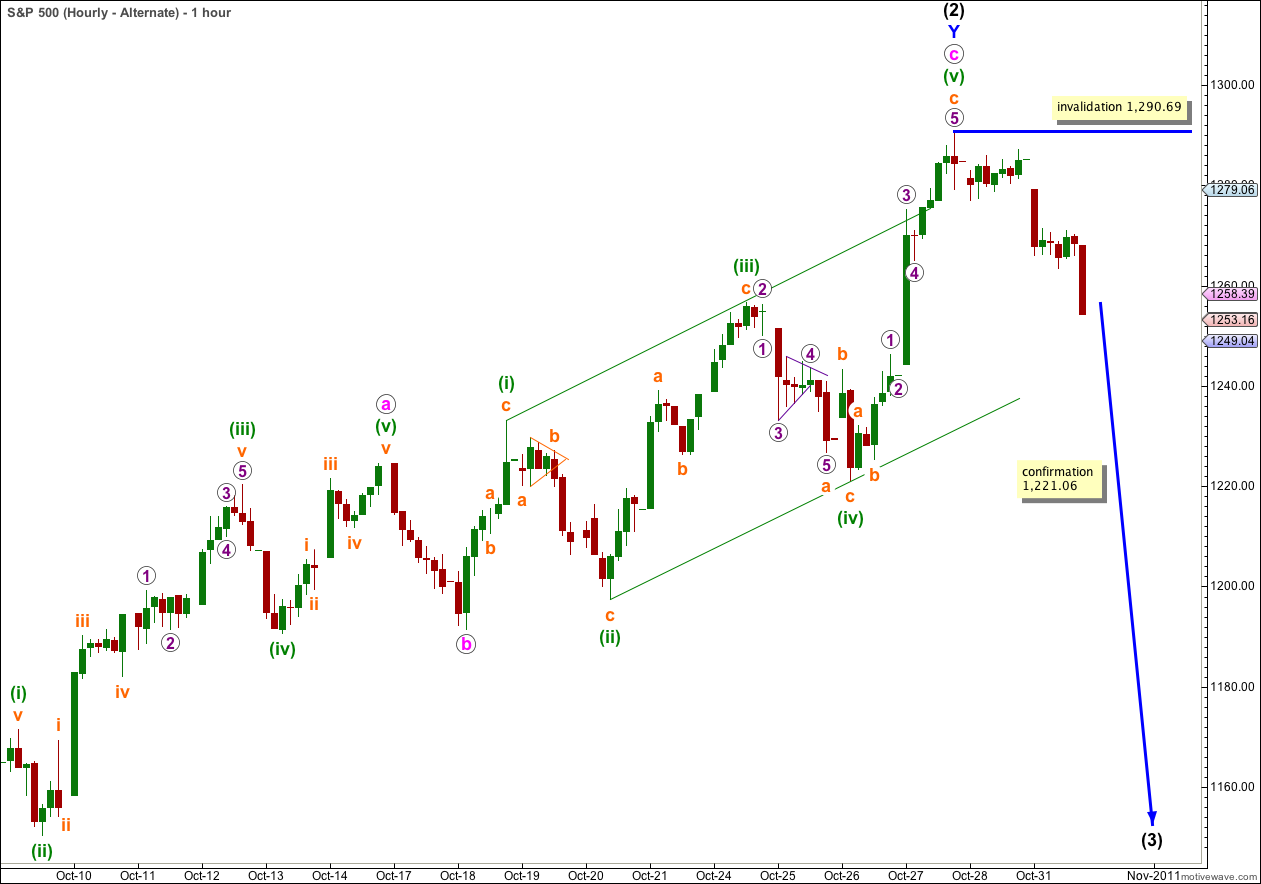
It is possible to see a complete ending diagonal structure for wave c pink.
This wave count has a lower probability than the main hourly wave count for a couple of reasons.
The subdivisions within waves (i) and (v) green look slightly forced on the 5 minute chart here. The main hourly wave count has a better fit for these pieces of movement.
This possible ending diagonal has a problem with its wave lengths. Wave (iii) is longer than (i) green, and wave (v) green is longer than wave (iii) green and the diagonal should be expanding. However, wave (iv) green is very slightly shorter than wave (ii) green.
Movement below 1,221.06 would confirm this wave count. Movement above 1,290.69 would invalidate it.