
Elliott Wave chart analysis for the S&P 500 for 26th October, 2011. Please click on the charts below to enlarge.
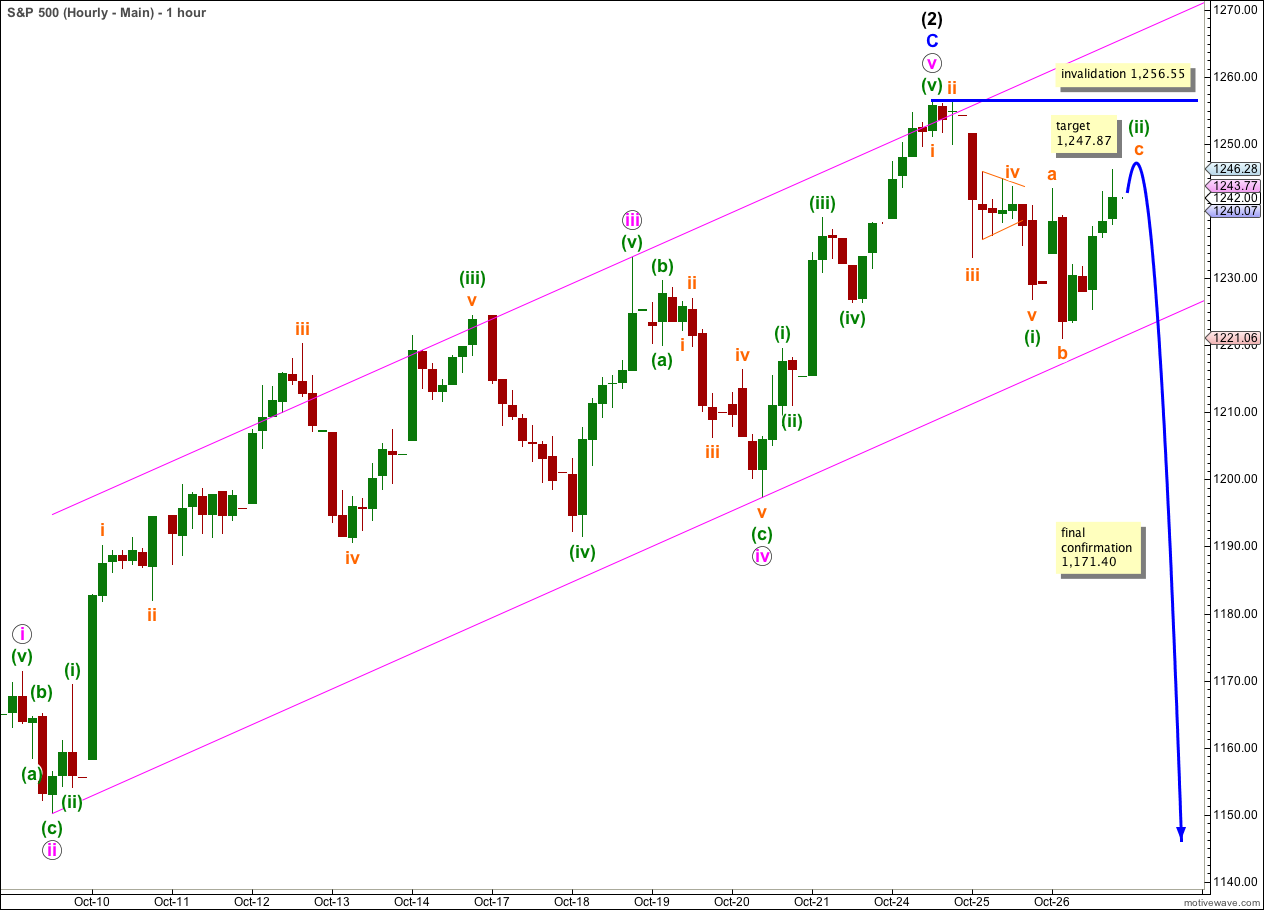
Wednesday’s session gave us pretty much what we expected: a new low followed by upwards movement with price remaining below 1,256.55. Both our wave counts remain valid and we still do not have confirmation of a trend change.
When we have confirmation of a trend change then I will move the invalidation point down to the end of wave (2) black. Until that time it must remain at the start of wave (1) black and we have to admit the possibility of further upwards movement. Wave (2) may not move beyond the start of wave (1).
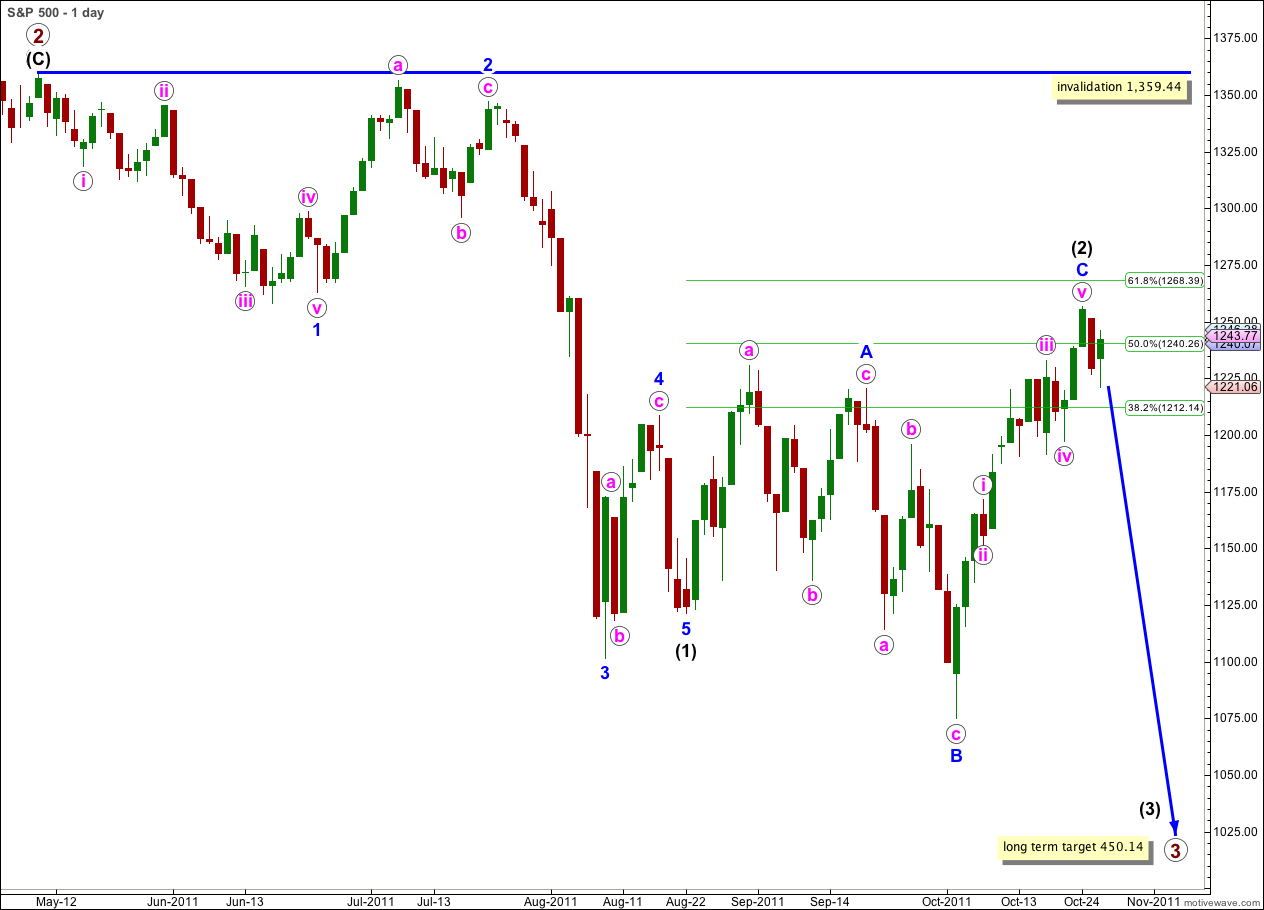
When we have confirmation of a trend change then I will calculate mid term targets for wave (3) black. It is premature to do so today.
Wave v orange did not move lower to reach the target at 1,220.65, which had a low probability. We did get a new low but it was part of a second wave correction and not the end of the impulse.
Ratios within wave (i) green are: wave iii orange is just 0.13 points longer than 4.236 the length of wave i orange, and wave v orange has no Fibonacci ratio to either of i or iii orange.
Within wave (ii) green expanded flat wave b orange was a 135% correction of wave a orange. At 1,247.87 wave c orange would reach 1.618 the length of wave a orange.
This wave count hinges on the downwards wave labeled b orange being a three wave structure, and not a five. On the 5 minute chart it can be subdivided perfectly into a three wave zigzag where waves A and C are almost perfectly equal in length.
The structure of wave c orange on the 5 minute chart looks to be incomplete. We may see a little further upwards movement when markets open tomorrow before price turns down for a third wave.
Wave (ii) green may not move beyond the start of wave (i) green. This wave count is invalidated with movement above 1,256.55.
Price found support just above the lower edge of the parallel channel drawn here. If the next wave down is a third wave then it should slice though this support quickly.
When we have a trend channel breach here on the hourly chart then we may have some confidence that we may have had a trend change. We still don’t have that yet.
Alternate Wave Count.
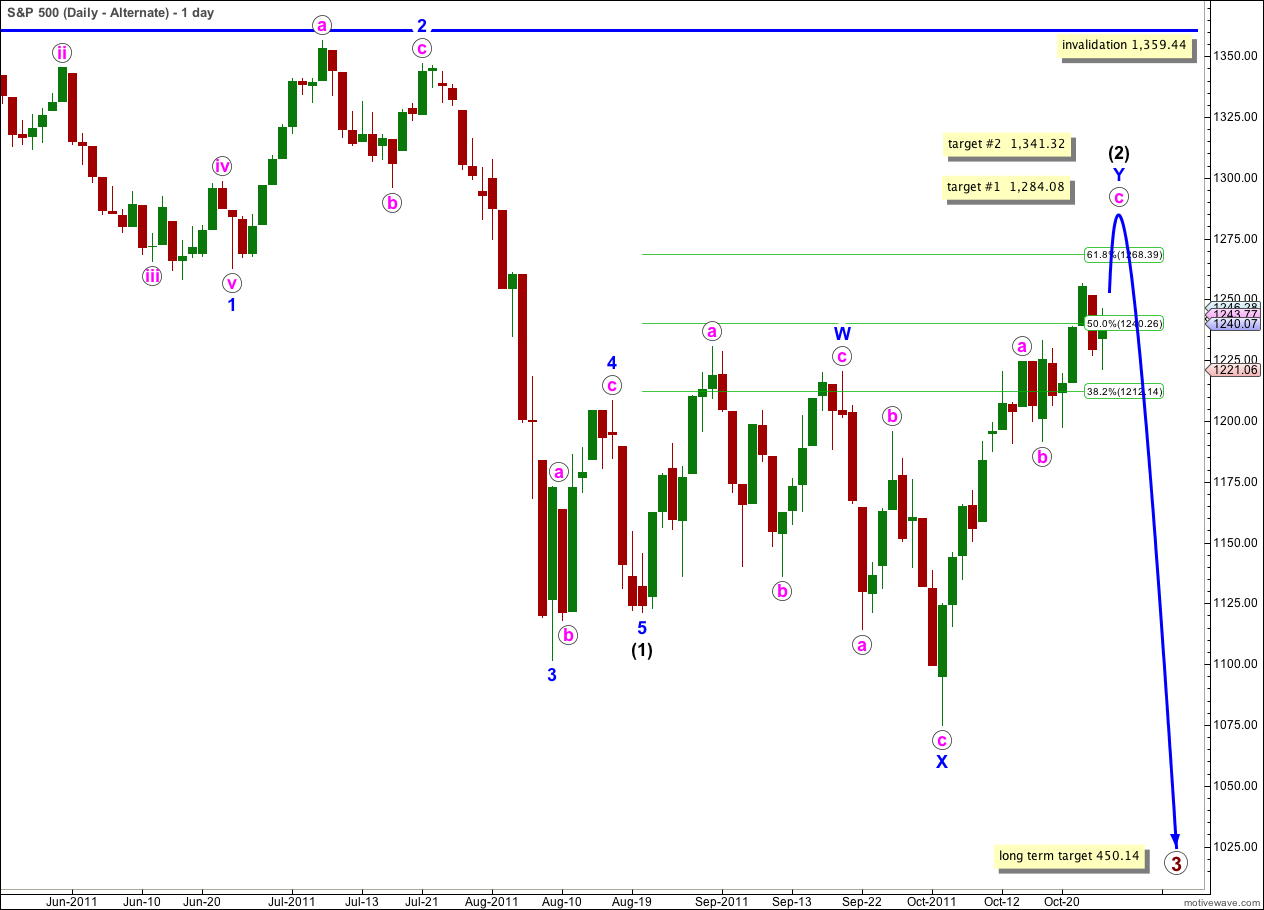
This alternate is possible, but looks less likely than the main wave count.
Wave (2) black may be unfolding as a double zigzag. The second zigzag, wave Y blue, is incomplete.
At 1,284.08 wave c pink would reach 0.618 the length of wave a pink. At 1,341.32 wave c pink would reach equality in length with wave a pink.
Wave (2) black may not move beyond the start of wave (1) black. This wave count is invalidated with movement above 1,359.44.
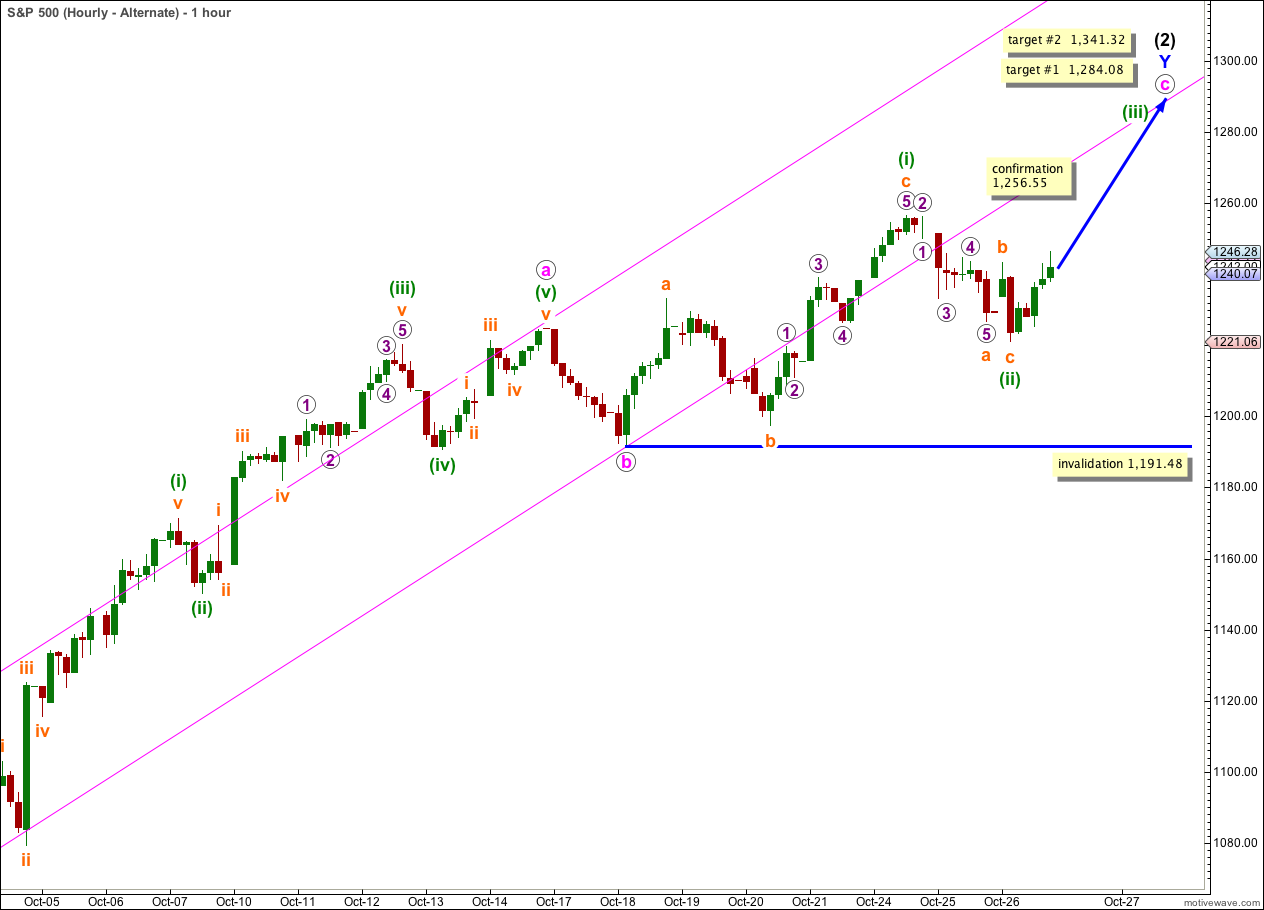
I have changed the structure of wave c pink to an ending diagonal rather than an impulse.
An ending diagonal requires all subwaves to be zigzags. Wave (i) green is complete, and wave (ii) green may also be complete. If wave (ii) green moves any lower then it may not move beyond the start of wave (i) green. This wave count is invalidated with movement below 1,191.48.
Movement to a new high above 1,256.55 would confirm this wave count. At that stage we should expect price to continue to rise towards at least the first target.
If wave c pink is an ending diagonal then it would complete with choppy, overlapping movement generally trending upwards for a few more days.