
Elliott Wave chart analysis for the S&P 500 for 25th October, 2011. Please click on the charts below to enlarge.
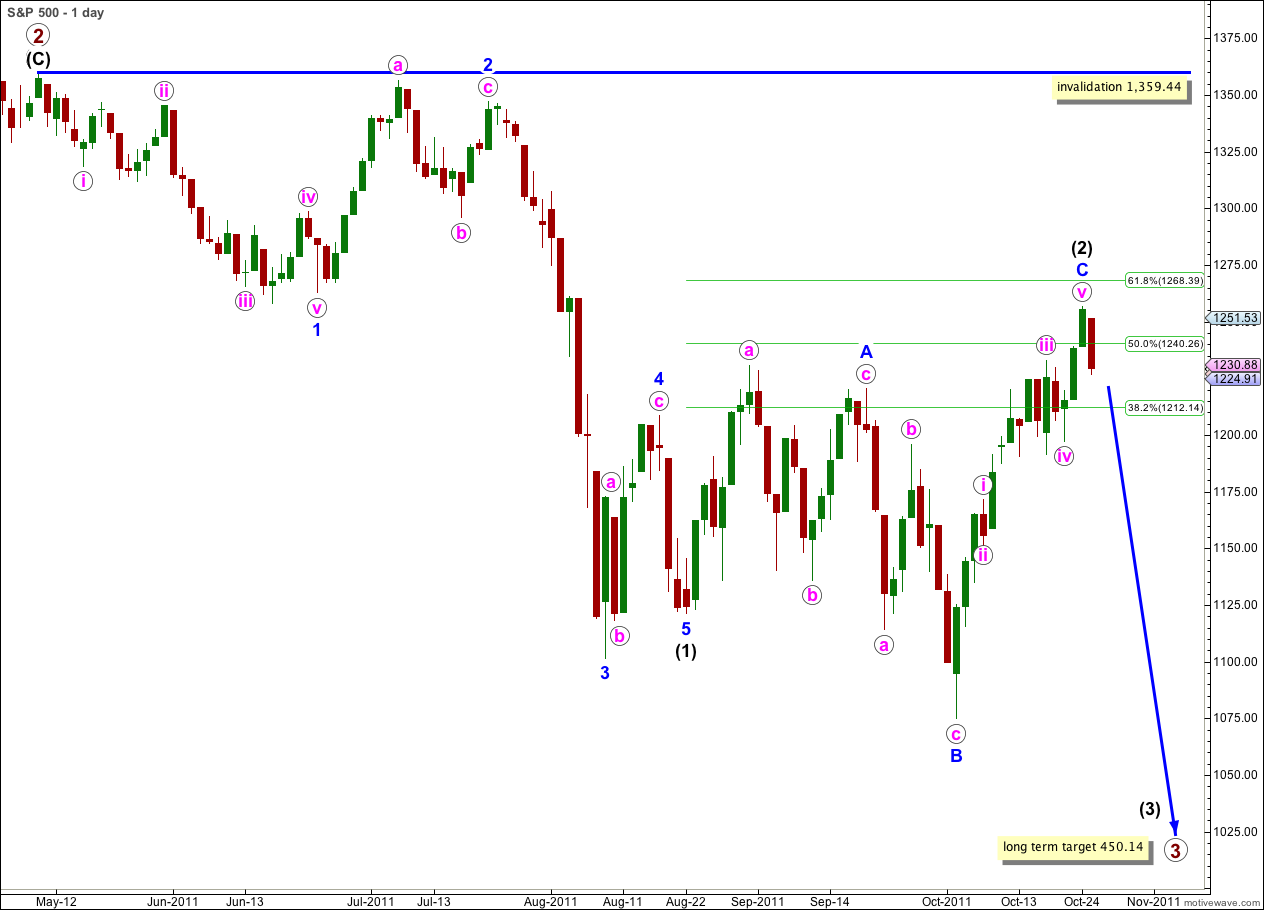
Price has moved lower during Tuesday’s session and the high from Monday remains unchallenged. This main wave count looks a little more likely today, but we still do not have confirmation of a trend change.
This is a big trend change with big implications. The next wave down should quickly take price to new lows and exhibit strong downwards momentum.
Wave (2) black may be a complete expanded flat structure, and wave C blue within it can be seen as a complete five wave impulse. Expanded flats do not lend themselves to parallel channels and we must use a parallel channel about wave C blue on the hourly chart to provide us with our first indication of a trend change.
While there is no confirmation of a trend change the invalidation point must remain at the start of wave (1) black at 1,359.44. We must admit the possibility of yet further upwards movement.
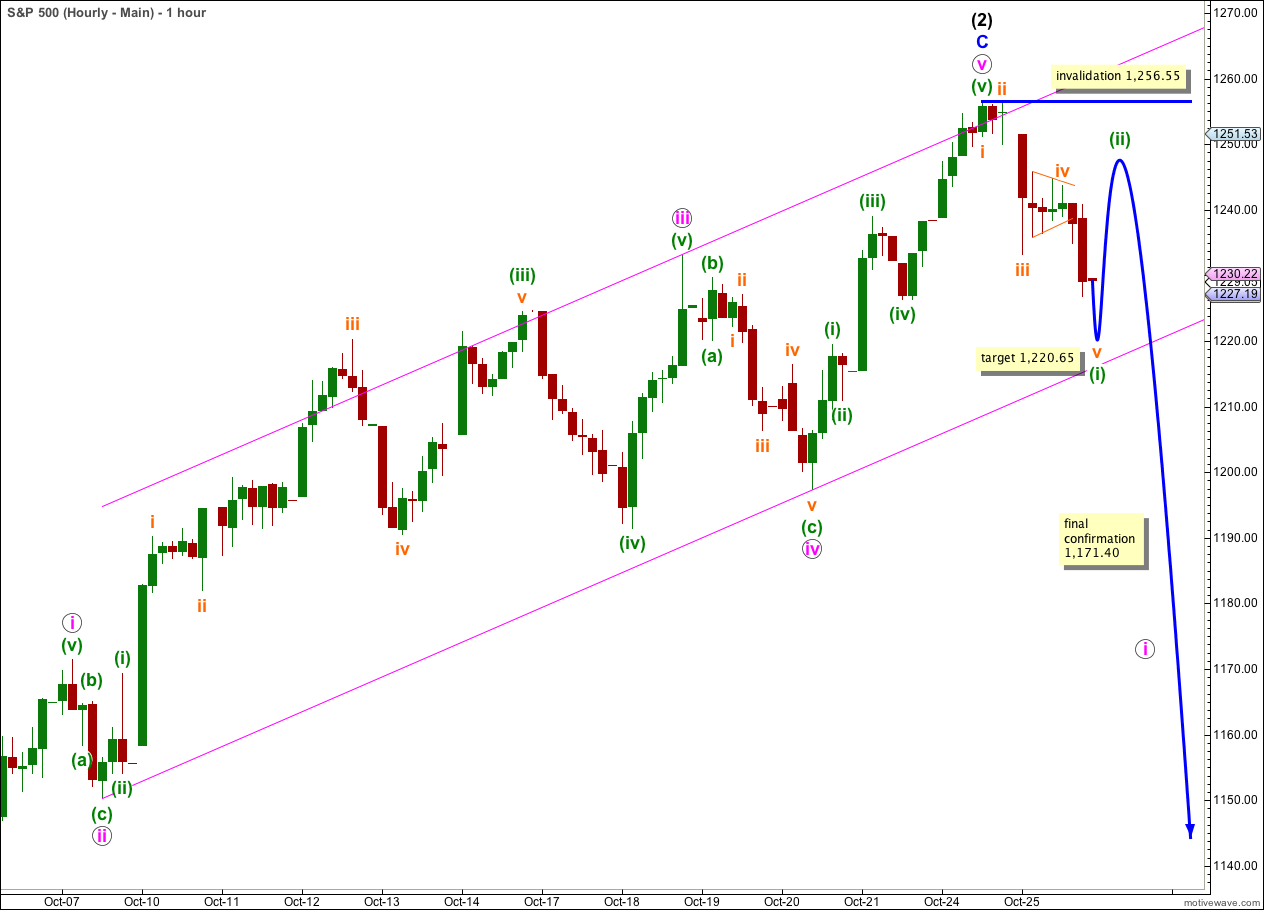
The structure for wave C blue here on the hourly chart looks to be close to textbook perfect. Waves ii and iv pink are both zigzags, but exhibit some alternation in the different lengths of their (a) and (c) waves. Waves i, iii and v pink all subdivide perfectly into impulses. Wave v pink has ended at the upper edge of the parallel channel drawn using Elliott’s technique.
When we can see at least one full hourly candlestick below this parallel channel we will have a channel breach. That will be our first indication that wave (2) black may be over and wave (3) black within primary wave 3 down would be underway. At this stage today we do not have that confirmation.
We have a five wave structure downwards on the hourly chart, with a perfect contracting triangle in the fourth wave position. Looking at wave v orange on the 5 minute chart shows it is likely to continue a little lower before it is complete.
Wave iii orange is just 0.13 points short of 4.236 the length of wave i orange. We may not see a Fibonacci ratio between wave v orange and either of iii or i orange. At 1,220.65 wave v orange would reach equality with wave iii orange. This target has a low probability.
Downwards movement may find support at the lower edge of the parallel channel, this may be where a second wave begins.
Wave (ii) green may not move beyond the start of wave (i) green. This wave count is invalidated with movement above 1,256.55.
Alternate Wave Count.
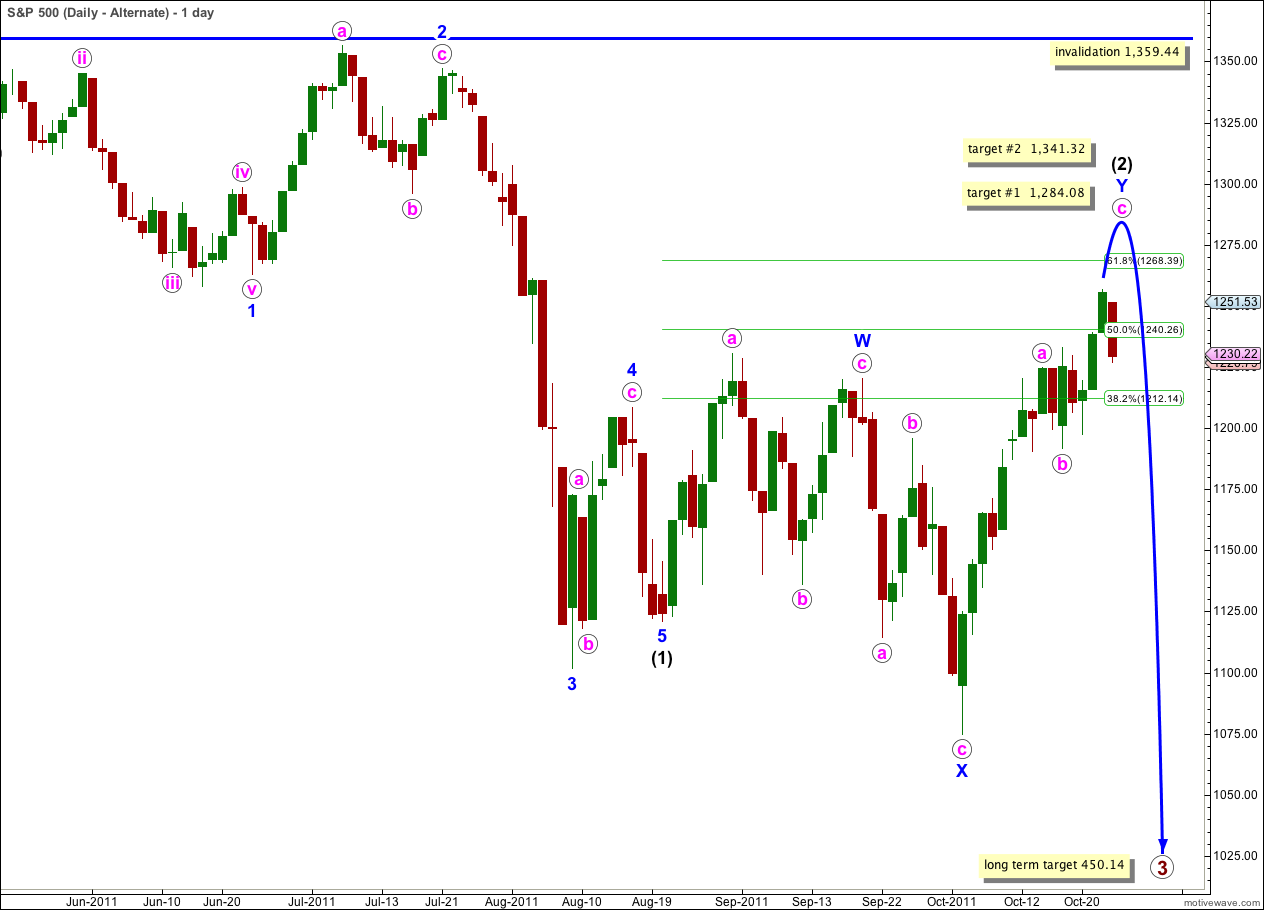
This is the same as yesterday’s alternate wave count.
Wave (2) black may be unfolding as a double zigzag. The second zigzag, wave Y blue, is incomplete.
At 1,284.08 wave c pink would reach 0.618 the length of wave a pink. At 1,341.32 wave c pink would reach equality in length with wave a pink.
Wave (2) black may not move beyond the start of wave (1) black. This wave count is invalidated with movement above 1,359.44.
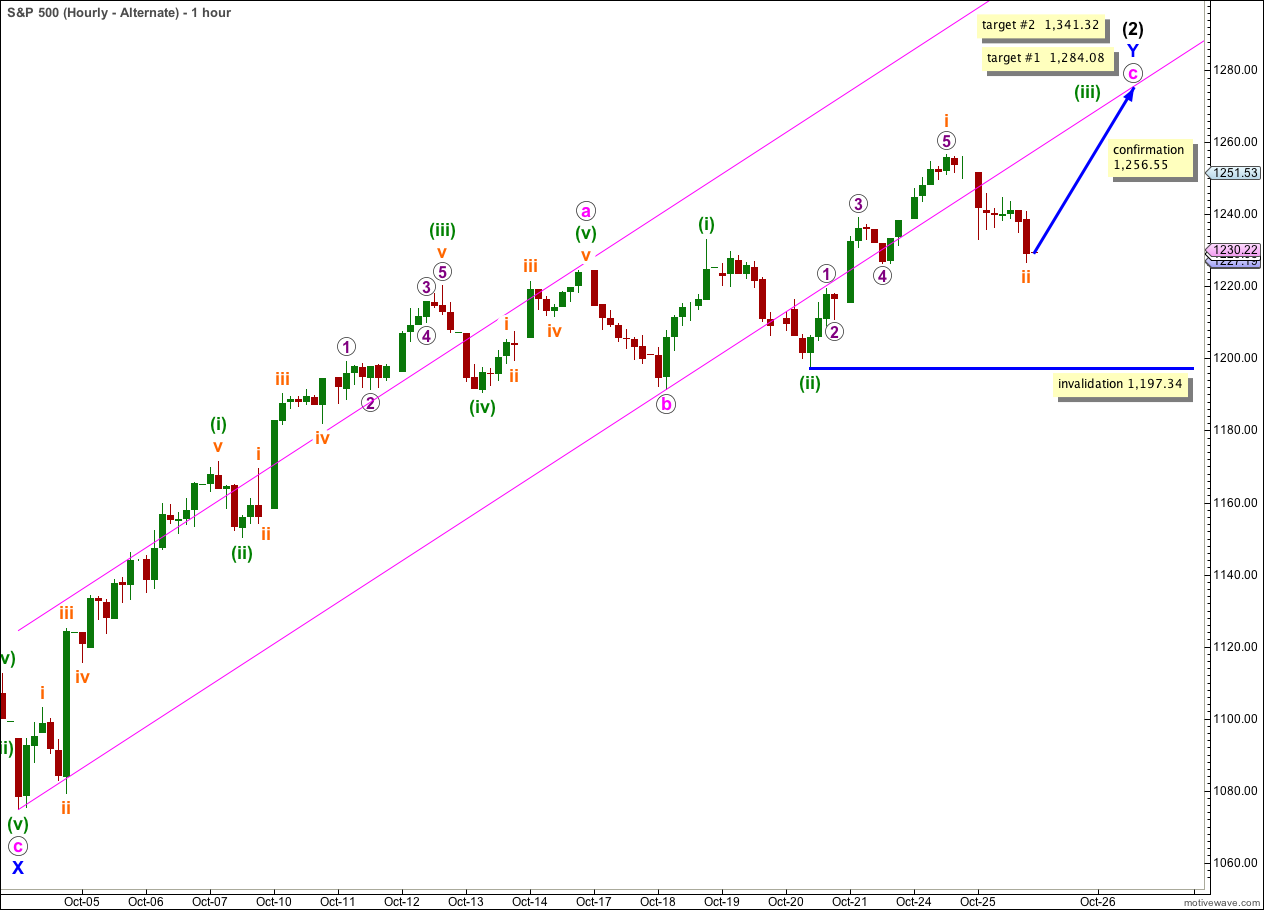
Downwards movement below 1,233.10 has invalidated yesterday’s hourly alternate wave count. This downwards movement cannot be wave (iv) green because it is within wave (i) green price territory.
We may move the degree of labeling for most recent movement all down one degree. Wave (iii) green may be extending.
Wave ii orange may not move beyond the start of wave i orange. This wave count is invalidated with movement below 1,197.34.
If this wave count is invalidated by downwards movement then at this stage I cannot see an alternate way to label most recent movement which fits with this wave count. Wave c pink cannot be a three wave structure, it must be a five. Movement below 1,197.34 (without a new high first) would leave wave c pink looking like a three and reduce the probability of this wave count significantly.
Movement above 1,256.55 would invalidate our main hourly wave count and confirm this alternate. At that stage we should expect further upwards movement and may use the targets calculated.