
Elliott Wave chart analysis for the S&P 500 for 24th October, 2011. Please click on the charts below to enlarge.
Last analysis had expected further upwards movement from the S&P 500 before a trend change, but the target at 1,248 was comfortably exceeded again.
This upwards movement now has a suspiciously three wave look to it and I have an alternate daily wave count for us today.
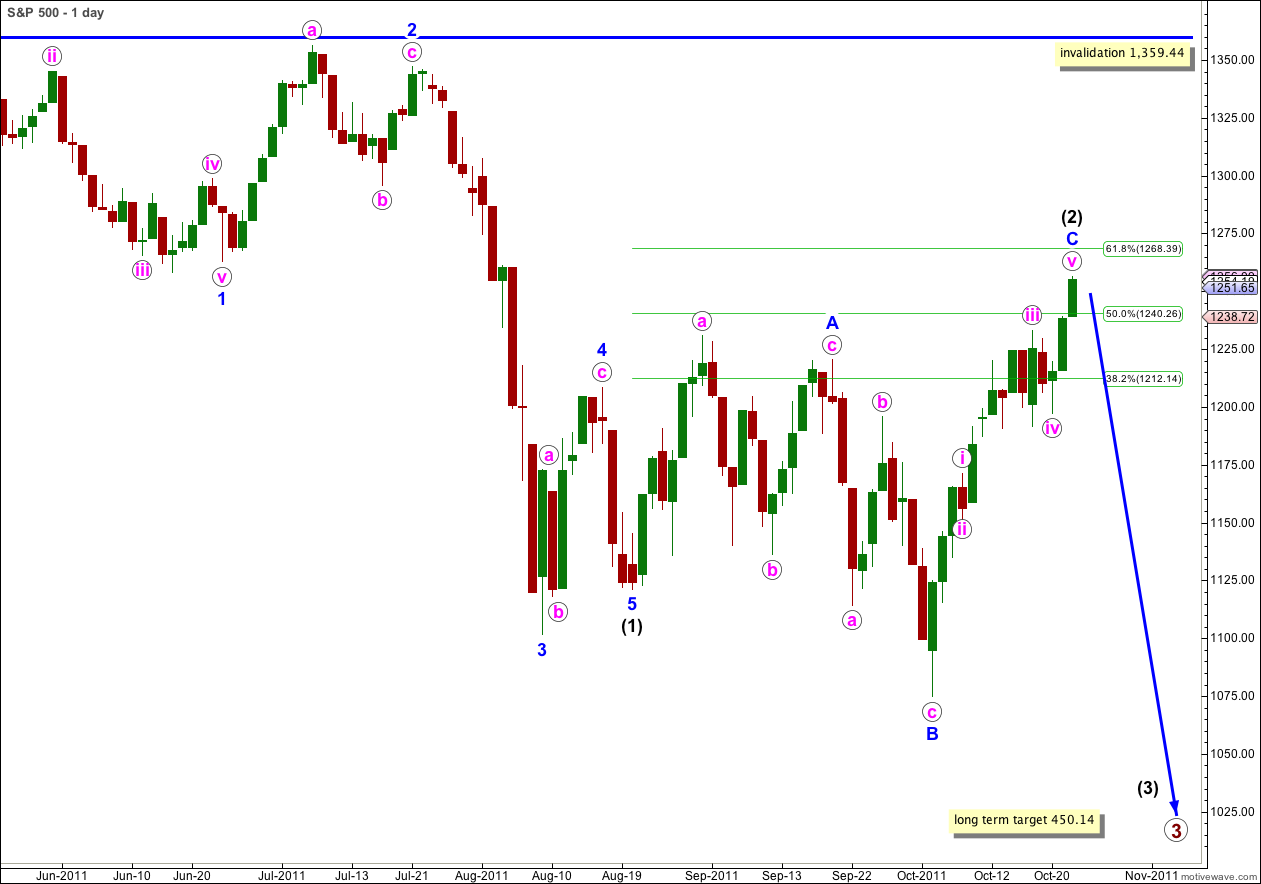
At the monthly and weekly chart level the trend remains very clearly down; downwards movement is impulsive and in five wave structures and the most recent upwards movement is an extremely clear three wave structure. If I have the end of primary 2 correctly labeled at 1,359.44 then this price point should not be breached. If it is then I may have the end of primary wave 2 incorrect and it may be at the price high at 1,370.58 (but I don’t think so).
Wave (2) black may not move beyond the start of wave (1) black. This wave count is invalidated with movement above 1,359.44.
If this main wave count is correct, and we are looking for a five wave structure upwards to complete, then it is very likely to be over here. If it continues further then I will prefer the alternate wave count below and we will switch them around.
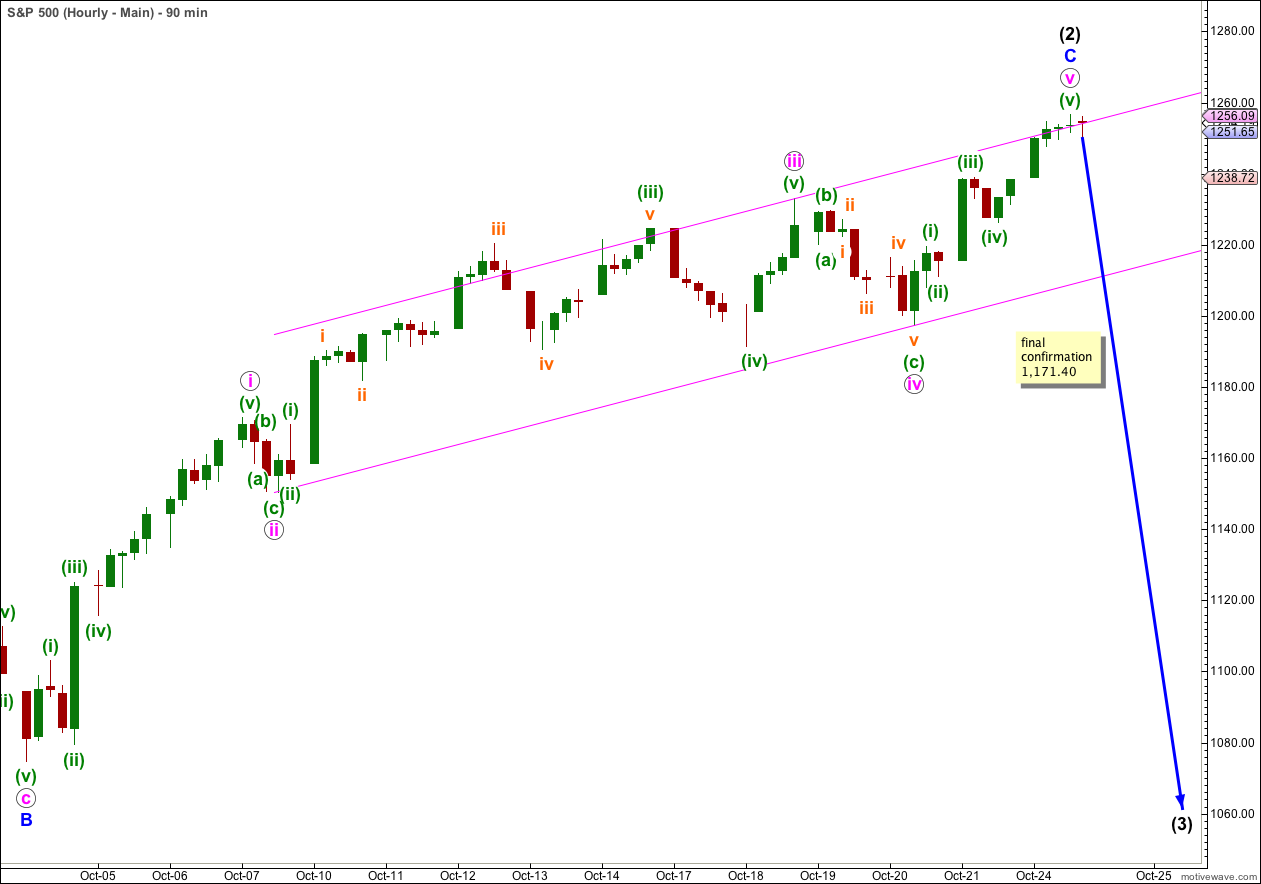
The target calculated yesterday was for wave v pink to reach 0.382 the length of wave i pink. Price reached and passed this point and wave v pink may have reached to 0.618 the length of wave i pink.
Wave C blue has no Fibonacci ratio to wave A blue.
Ratios within wave C blue are: wave iii pink has no Fibonacci ratio to wave i pink, and wave v pink is just 0.51 points short of 0.618 the length of wave i pink.
Ratios within wave v pink are: wave (iii) green has no Fibonacci ratio to wave (i) green, and wave (v) green is 2 points short of equality with wave (iii) green.
If upwards movement is over then there are adequate Fibonacci ratios to support this.
Movement below the pink parallel channel here on the hourly chart would be the first indication of a trend change. Movement below 1,171.40 would provide full and final confirmation of a trend change.
If price continues to move higher we will use the alternate wave count below.
Alternate Wave Count.
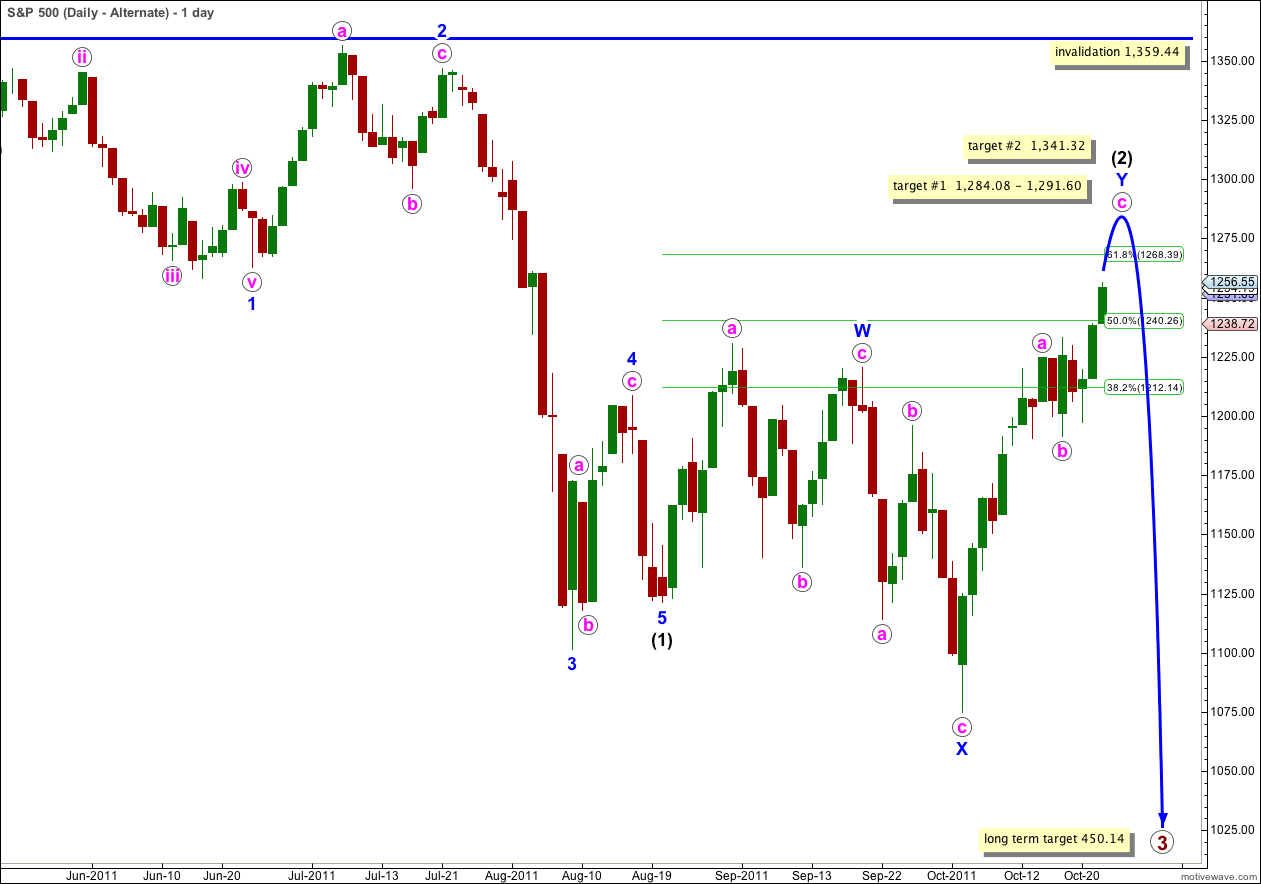
Wave (2) black may be a double zigzag rather than an expanded flat. I am considering this possibility because recent upwards movement looks like an unfolding zigzag.
At 1,284.08 wave c pink would reach 0.618 the length of wave a pink. At 1,341.32 wave c pink would reach equality in length with wave a pink.
Wave (2) black may not move beyond the start of wave (1) black. This wave count is invalidated with movement above 1,359.44.
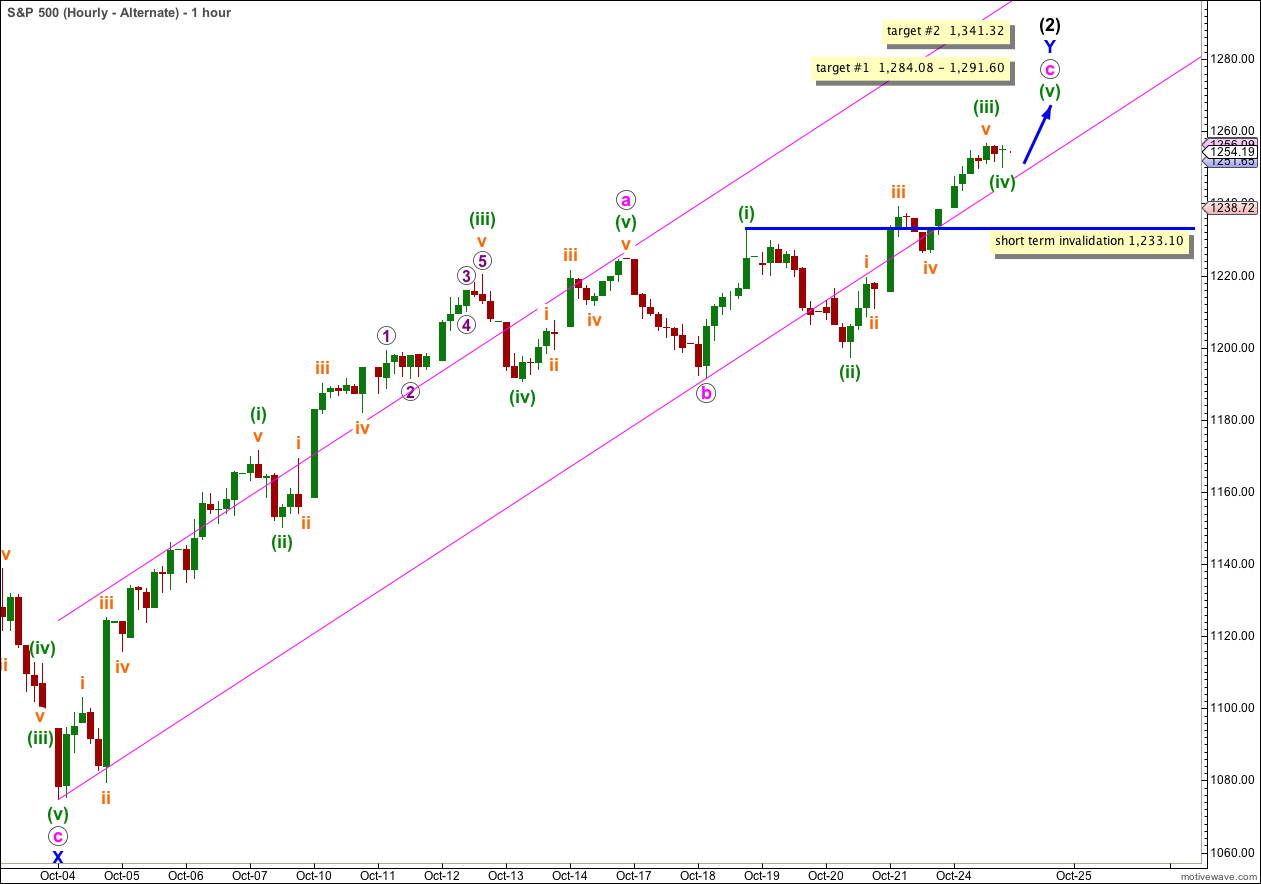
This hourly chart shows all of more recent upwards movement since the low labeled X blue.
Wave a pink subdivides into an impulse. Ratios within wave a pink are: wave (iii) green has no Fibonacci to wave (i) green, and wave (v) green is 2.88 points short of 0.382 the length of wave (i) green.
Within wave c pink wave (iii) green has no Fibonacci ratio to wave (i) green. At 1,291.60 wave (v) green (if it has begun at 1,249.98) would reach equality in length with wave (i) green. This is fairly close to 1,284.08.
This wave count expects further upwards movement before wave (2) black could be a complete structure.
Any further downwards movement for wave (iv) green may not move into wave (i) green price territory. This wave count is invalidated with movement below 1,233.10 (before upwards movement for wave (v) green completes the structure).
The parallel channel drawn here is Elliott’s technique for a correction. I would expect wave c pink to end about the upper edge of this channel. Thereafter, a channel breach to the downside would indicate a trend change.