
Elliott Wave chart analysis for the S&P 500 for 20th October, 2011. Please click on the charts below to enlarge.
The S&P 500 has moved mostly sideways for Thursday’s session, and with price remaining below 1,233.10 the possibility that we have recently seen a big trend change remains.
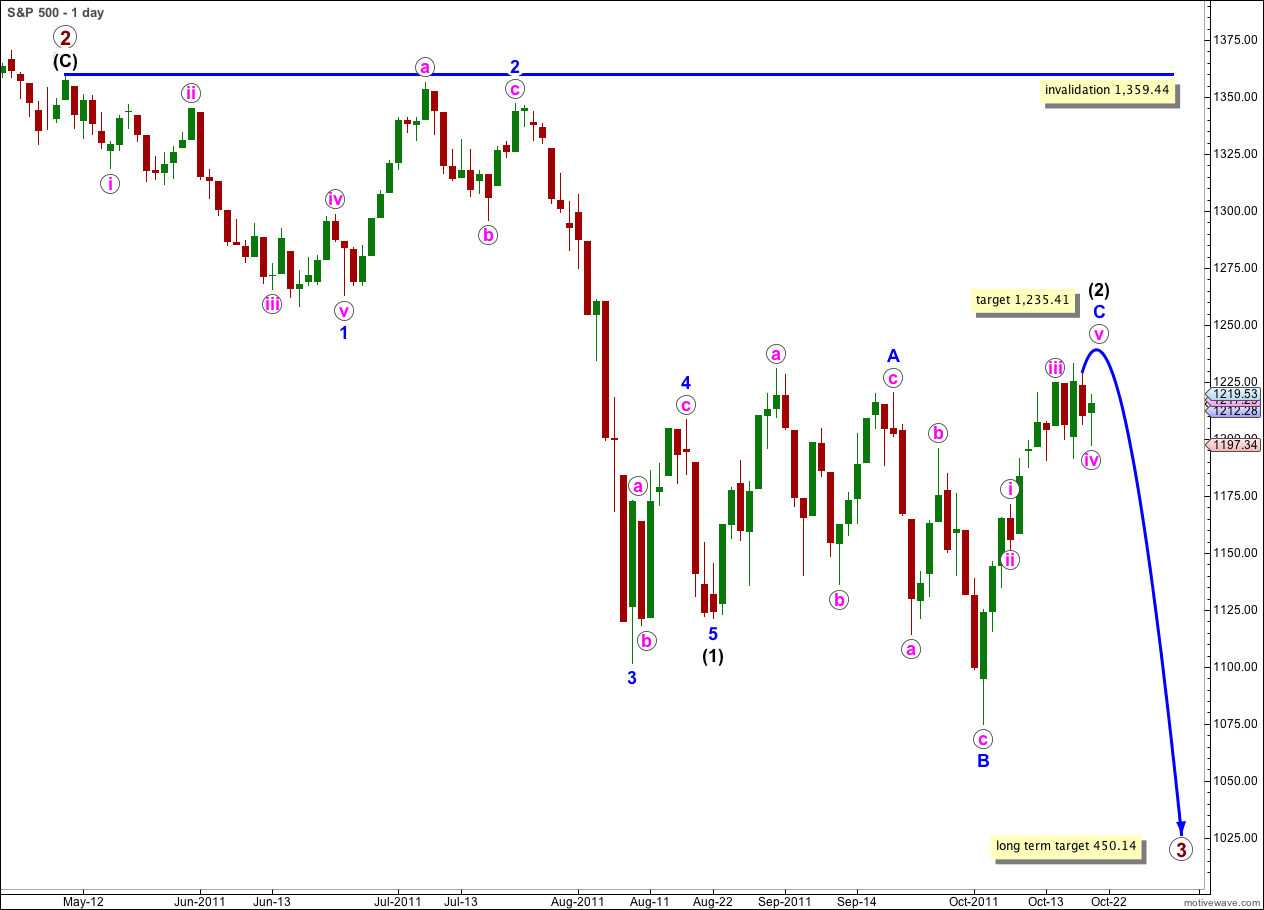
Any further upwards movement of wave 2 blue, and we may yet see one small final push, may not move beyond the start of wave 1 blue. This wave count is invalidated with movement above 1,359.44.
We now have a fairly clear five wave structure down on the hourly chart, but it is very small. We do not have a trend channel breach and price remains above our confirmation point of 1,171.40.
After Thursday’s session there is a little more information indicating a trend change. The main hourly wave count has, I consider, a lower probability than the alternate. I will leave these as labeled though because we should always assume that the trend remains the same, until proved otherwise.
We still do not have confirmation of a trend change.
Main Hourly Wave Count.
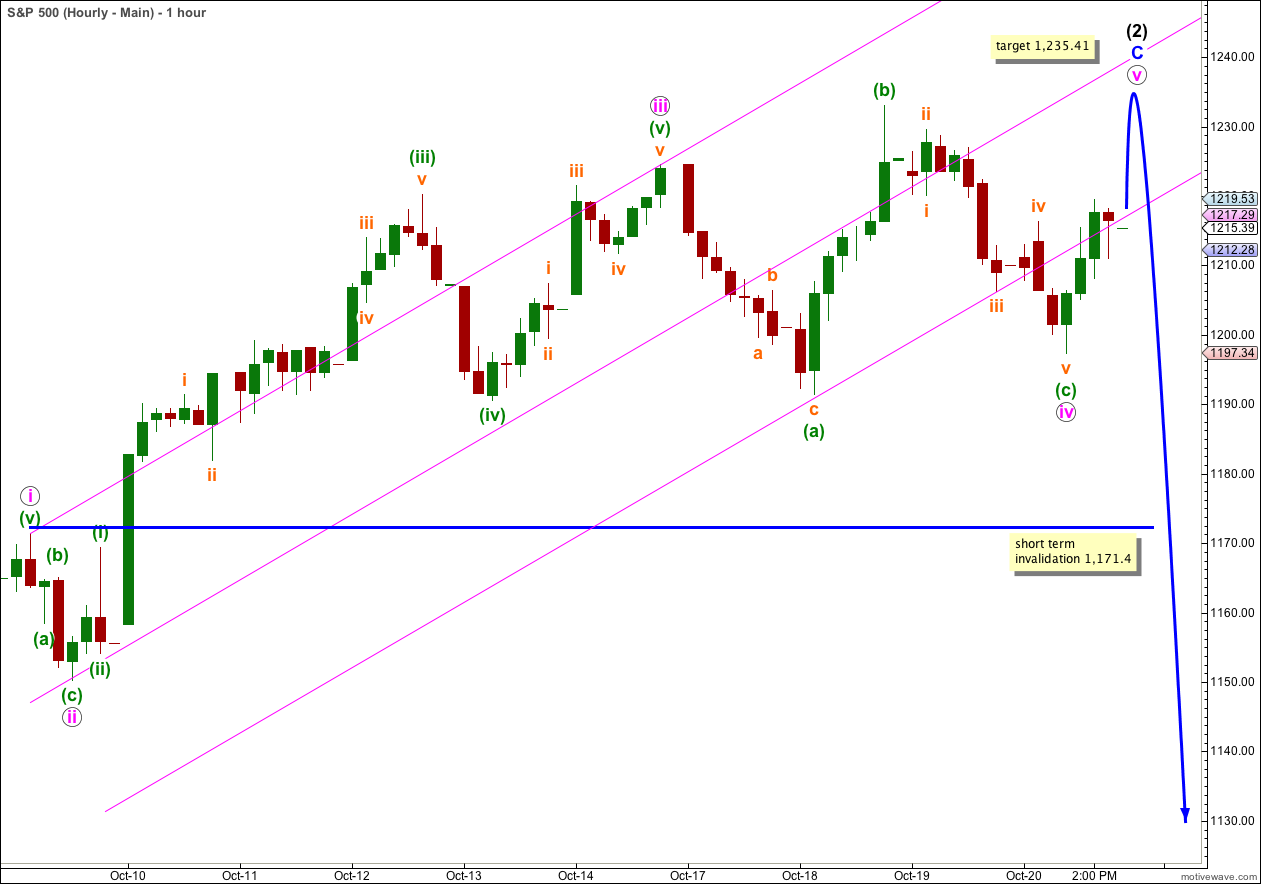
Thursday saw the completion of a five wave structure to the downside labeled wave (c) green to complete a flat correction for wave iv pink.
Wave iv pink is now well out of proportion to wave ii pink which reduces the probability of this wave count.
More importantly, wave (c) green did not end beyond the end of wave (a) and so this structure is labeled as a rare running flat correction. We should only expect to see one of these if upwards pressure is extreme, and there is no evidence of this. This structure further reduces the probability of this wave count today.
We have a small breach of the double wide parallel channel drawn here on this hourly chart, but this is not indication of a trend change. Sometimes fourth waves overshoot trend channels.
It is the parallel channel on the alternate hourly chart below which we need to see breached to indicate a trend change.
Alternate Hourly Wave Count.
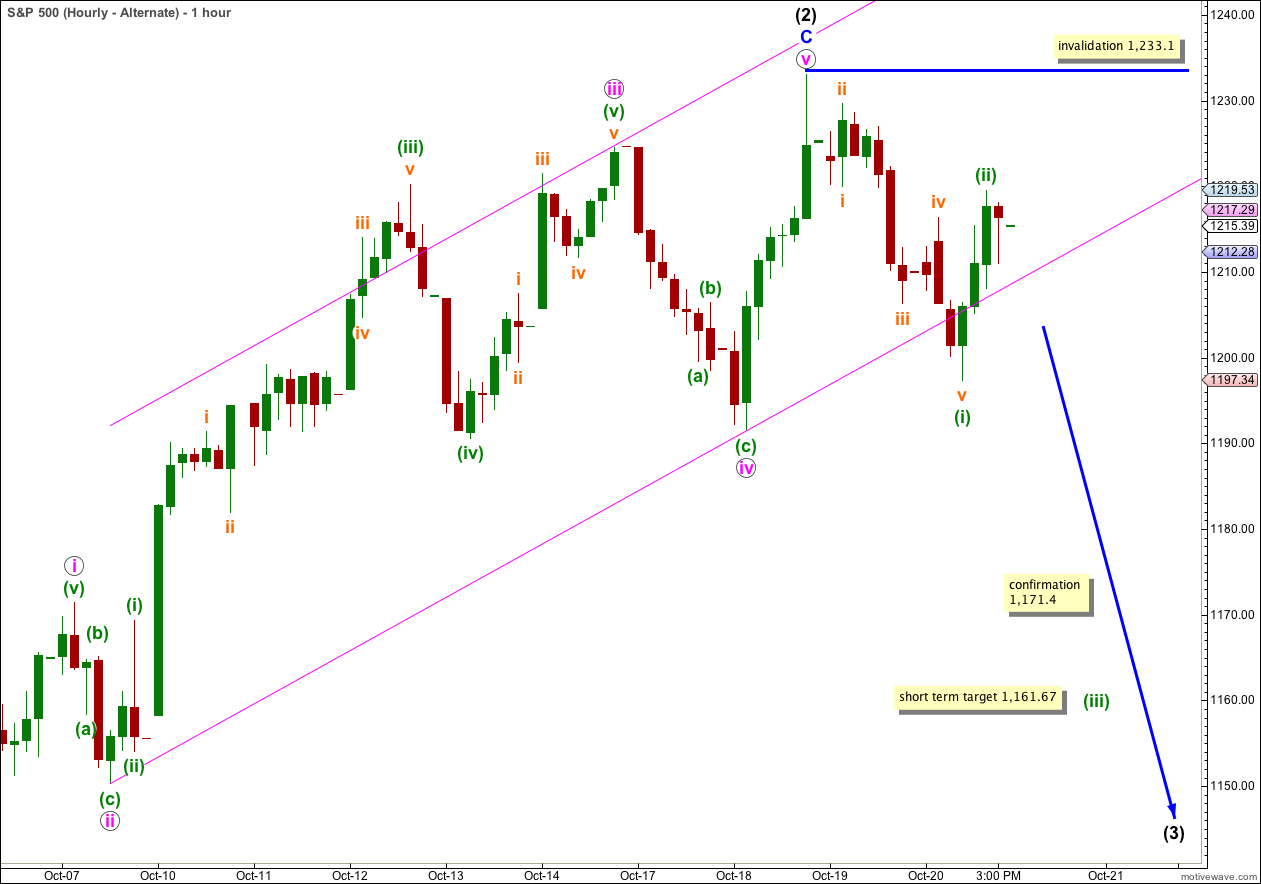
We now have a clear five wave structure downwards on the hourly chart, labeled (i) green. We do not have a trend channel breach of the pink parallel channel containing wave C blue upwards though.
Ratios within wave (i) green are: wave iii orange has no Fibonacci ratio to wave i orange, and wave v orange is 1.76 points longer than 1.618 the length of wave i orange (lengths and ratios were calculated on the 5 minute chart and not the hourly).
Wave (i) green subdivides perfectly into an impulse, and each of its subwaves subdivide perfectly also on the 5 minute chart.
Wave (ii) green subdivides into a clear three wave structure on the 5 minute chart, so far. It could continue yet higher and develop into a 5, but this looks unlikely.
What seems most likely after Thursday’s movement is that we shall see overall downwards movement from the S&P 500 from here, with increasing momentum.
Movement below 1,171.40 would provide final confirmation of a trend change.
At 1,161.67 wave (iii) green would reach 1.618 the length of wave (i) green (if wave (ii) green is over here and does not continue higher as a double zigzag).
Any further upwards movement of wave (ii) green may not move beyond the start of wave (i) green. This wave count is invalidated with movement above 1,233.10.