
Elliott Wave chart analysis for the S&P 500 for 19th October, 2011. Please click on the charts below to enlarge.
The S&P 500 did not move a little higher as yesterday’s analysis had expected it to do, but price has remained above 1,191.48 and we do not yet have confirmation of a trend change.
Today I have a more reliable but lower confirmation / invalidation point for us. We should still be using the parallel channel about wave C blue on the hourly chart as our first indication of a trend change. Movement below 1,171.40 would now provide strong confidence in a trend change.
Wednesday’s movement was not clear in either structure or momentum. So far on the 5 minute and hourly chart this downwards movement looks like a three, but threes can continue and develop further into fives. Momentum at the very beginning of wave (3) black downwards may not necessarily be very strong and we have no clues as to a trend change yet.
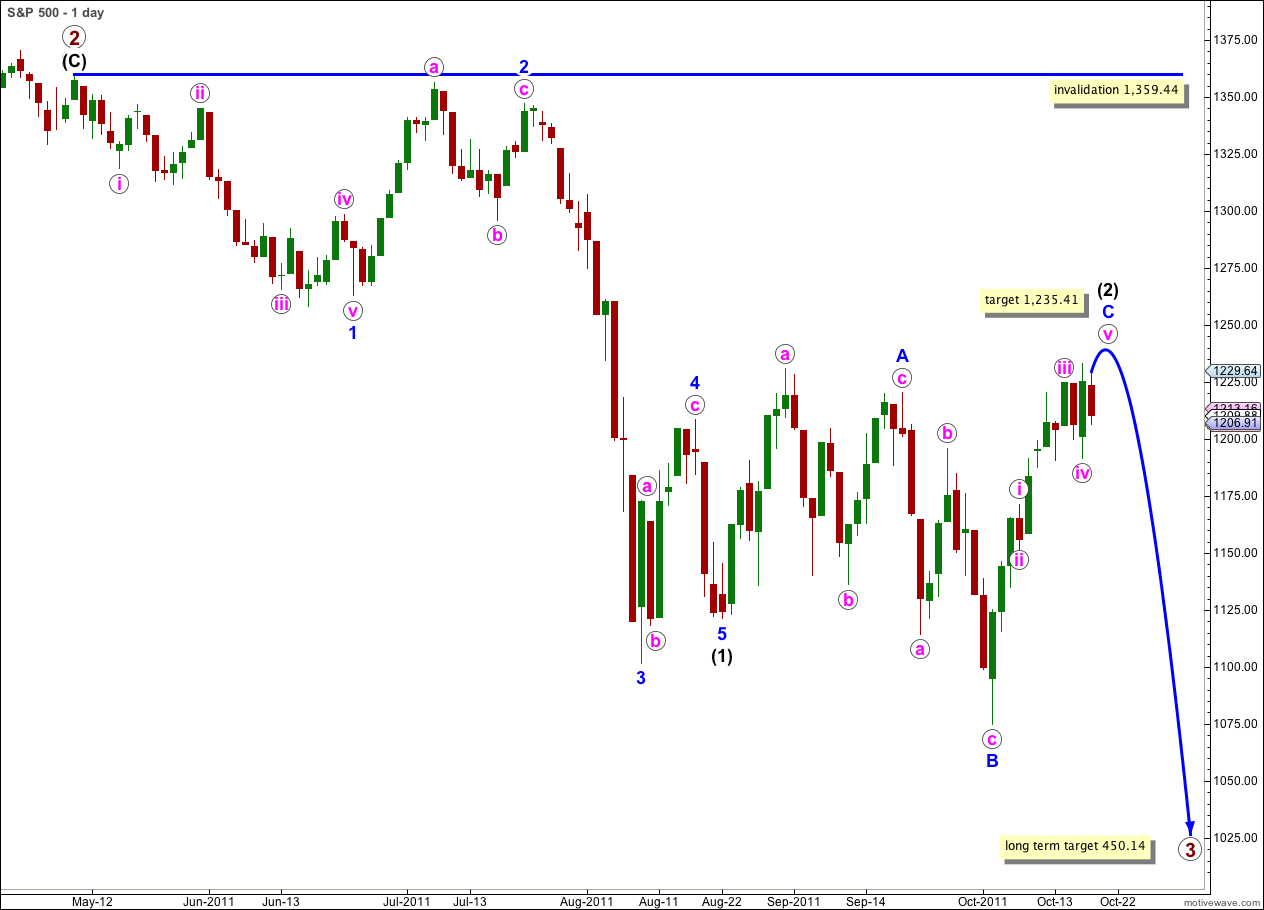
Any further upwards movement of wave 2 blue, and we may yet see one small final push, may not move beyond the start of wave 1 blue. This wave count is invalidated with movement above 1,359.44.
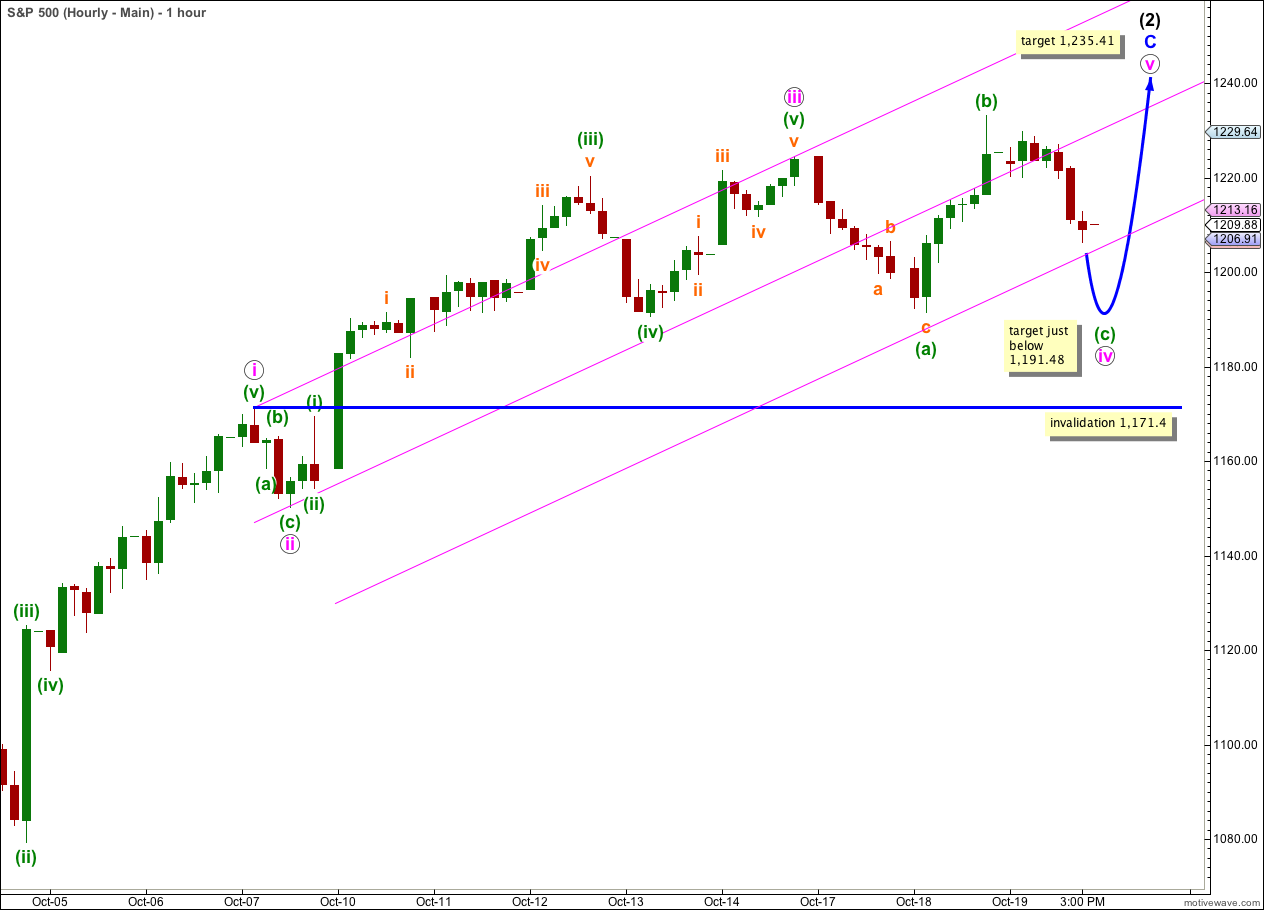
This will be today’s main hourly wave count, only because we should assume the trend remains the same until proved otherwise. While price remains within the parallel channel on the alternate hourly chart and above 1,171.40 we have no confirmation of a trend change and we should assume the trend remains up.
Wave iv pink here is seen as possibly continuing further as a regular flat correction. This would expect wave (c) green to end just a little beyond the end of wave (a) green at 1,191.48.
Wave iv pink may not move into wave i pink price territory. This wave count is invalidated with movement below 1,171.40.
This wave count has a strange look in that wave iv pink is now significantly out of proportion to wave ii pink. However, this does not break any Elliott wave rules and so the possibility may be considered. The probability is reduced with the problem of proportionality though.
If we are to see one last small upwards wave before a big trend change then it may end about 1,235.41 where wave C blue would reach 1.618 the length of wave A blue.
Alternate Hourly Wave Count.
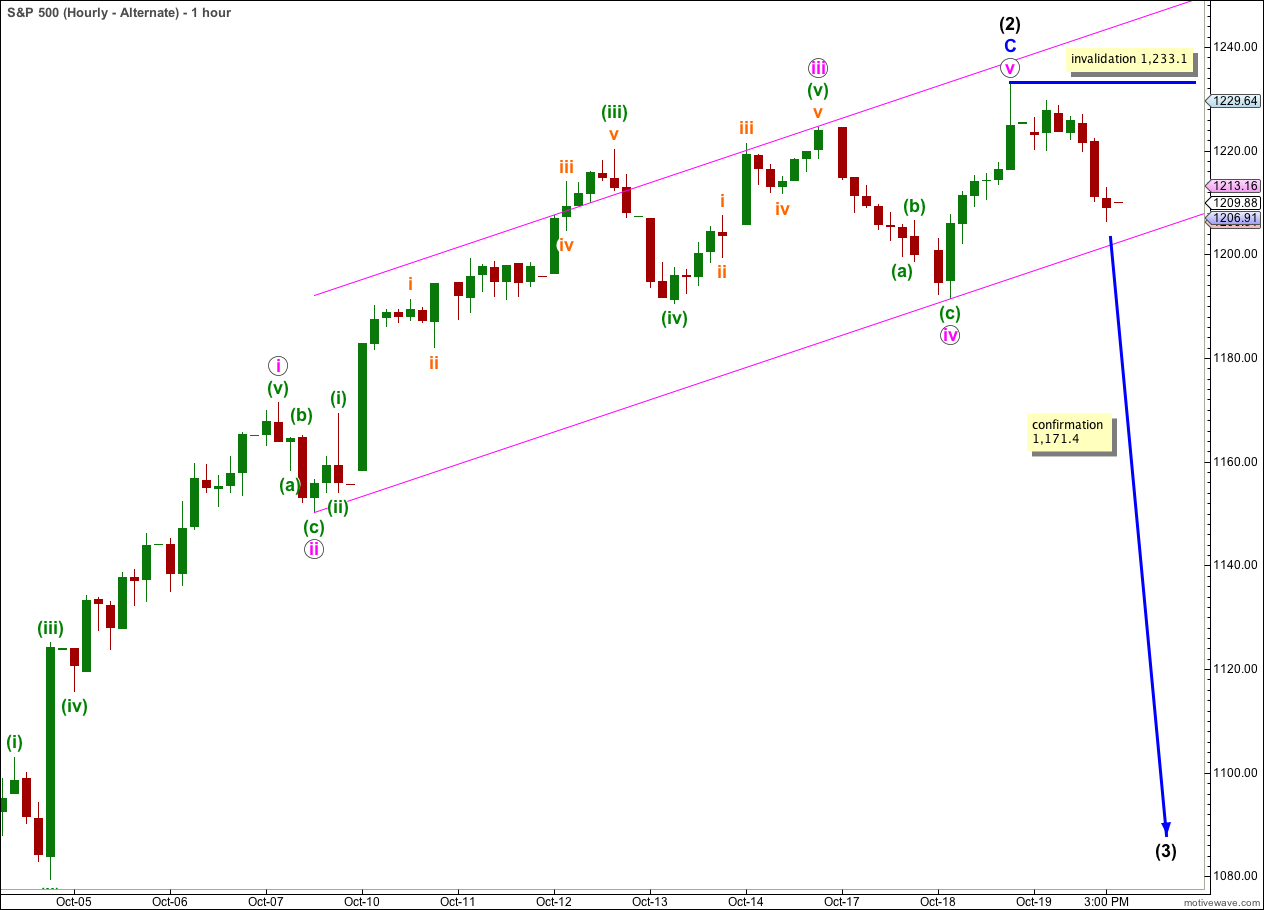
This wave count has a better look overall than the main hourly wave count. It may be considered to have a slightly higher probability. But I will keep it as an alternate only because we have no confirmation yet of a trend change.
If wave (2) black was over at 1,233.10 then wave C blue was just 2.21 points short of 1.618 the length of wave A blue, giving this second wave expanded flat a typical look and ratios.
There are no Fibonacci ratios within wave C blue at pink degree.
If we see movement below this parallel channel we shall have trend channel confirmation of a trend change.
Further movement below 1,171.40 would eliminate the possibility that downwards movement could be a fourth wave correction. At that stage we would could have a lot of confidence that the S&P has had a trend change. Most likely a third wave down would have begun.
Wave (3) black should take price quickly to new lows and see an increase in momentum.
When a trend change is confirmed by a channel breach then I will again calculate targets for wave (3) black. It would be premature to do that now.