
Elliott Wave chart analysis for the S&P 500 for 18th October, 2011. Please click on the charts below to enlarge.
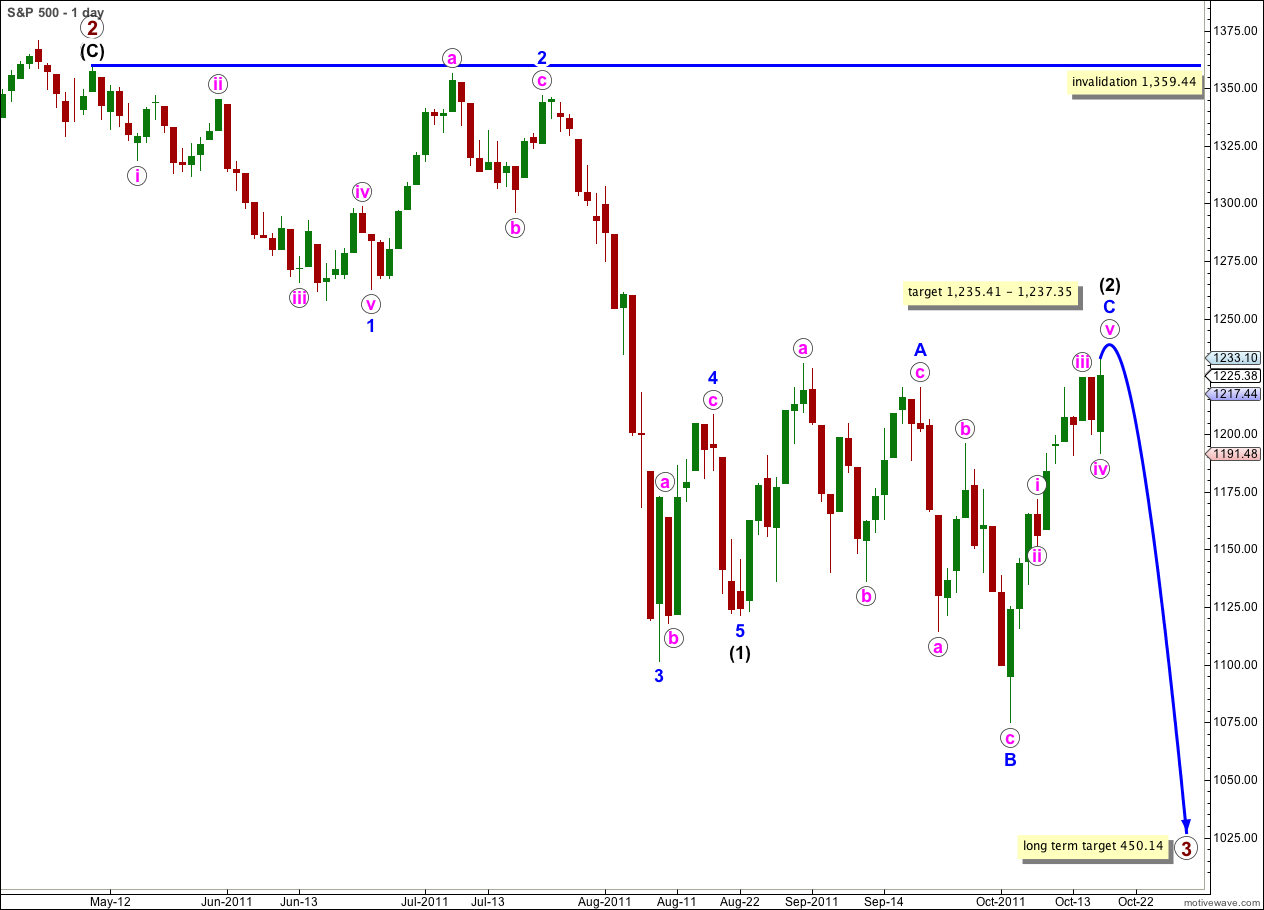
With price remaining above 1,190.58 and moving above 1,224.48 we do not yet have confirmation of a trend change. We should expect that a little more upwards movement is likely before wave (3) black downwards begins.
I have again reanalysed wave C blue upwards and we have a new target which has a higher upper edge, but does not expect much more upwards movement. If wave C blue ends in two more trading days it would have lasted a Fibonacci 13 days, and so it could possibly end on or by Friday.
Wave (2) black may not move beyond the start of wave (1) black. This wave count is invalidated with movement above 1,359.44.
When wave (2) black is complete then wave (3) black downwards should quickly take the S&P 500 to new lows and see an increase in downwards momentum.
The outlying possibility will remain that wave (2) black could continue yet further sideways as a double flat or double combination. That would be expecting a wave downwards which may make a new low and the next direction expected does not diverge from the chart above. I will keep this alternate idea in mind and publish it when appropriate. At this stage if wave (2) black is close to being complete now it looks nicely in proportion to wave (1) black, and this looks like the most likely wave count.
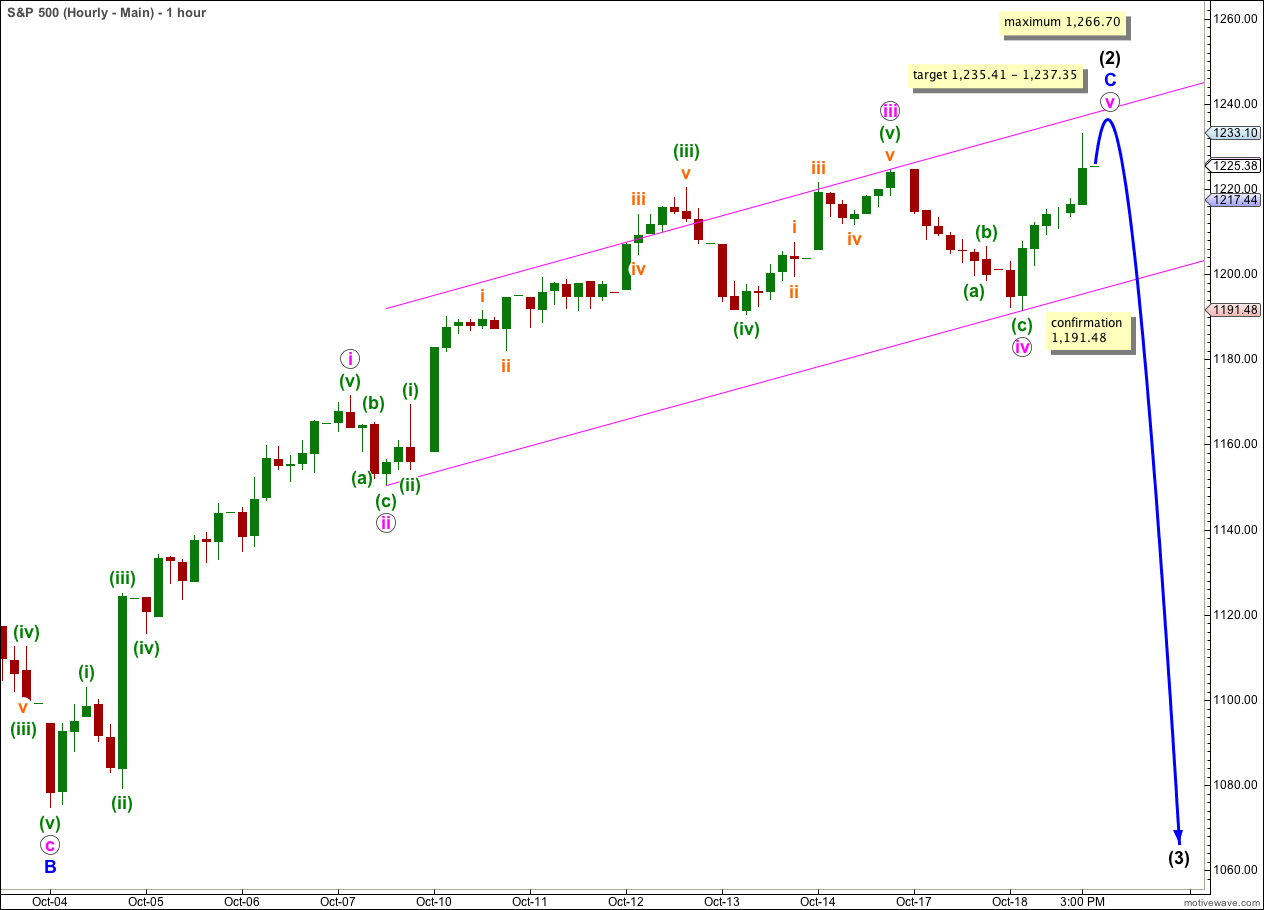
I was not happy with the alternate hourly wave count from yesterday and have taken some time to go back over the 5 minute chart for another interpretation.
Here wave iii pink still has no Fibonacci ratio to wave i pink and it is shorter than wave i. Wave v is still limited and is likely to exhibit a Fibonacci ratio to either of i or iii pink.
At 1,237.35 wave v pink would reach 0.618 the length of wave iii pink. This target is fairly close to our previous target of 1,235.41 where wave C blue would reach 1.618 the length of wave A blue. This target zone has a reasonably high probability.
Wave v pink may not be longer than equality with wave iii pink because wave iii may not be the shortest wave. Wave v pink has its maximum length at 1,266.70.
Ratios within wave iii pink are: wave (iii) green has no Fibonacci ratio to wave (i) green, and wave (v) green is 2.96 points longer than 1.618 the length of wave (i) green.
Within wave (iii) green of wave iii pink there are no Fibonacci ratios between waves i, iii and v orange (not within a variation of less than 10% anyway).
Within wave (v) green of wave iii pink ratios are: wave iii orange has no Fibonacci ratio to wave i orange, and wave v orange is 0.82 points longer than 0.618 the length of wave iii orange.
Waves ii and iv pink are both zigzags. There is no alternation in structure, but there is alternation in depth of correction and alternation within the structure. Wave iv pink was a deeper correction of wave iii pink than wave ii pink was of wave i pink. Within wave iv pink wave (c) green has a 0.618 Fibonacci ratio to wave (a) green and within wave ii pink waves (a) and (c) green are close to equality.
I have again redrawn the parallel channel about wave C blue upwards. When we see at least one or two hourly candlesticks below this channel then we may have trend channel confirmation of this trend change.
Movement below 1,191.48 would also provide some confirmation of a trend change as at that stage it may not be a second wave correction within wave v pink and so wave v pink would have to be over.