
Elliott Wave chart analysis for the S&P 500 for 17th October, 2011. Please click on the charts below to enlarge.
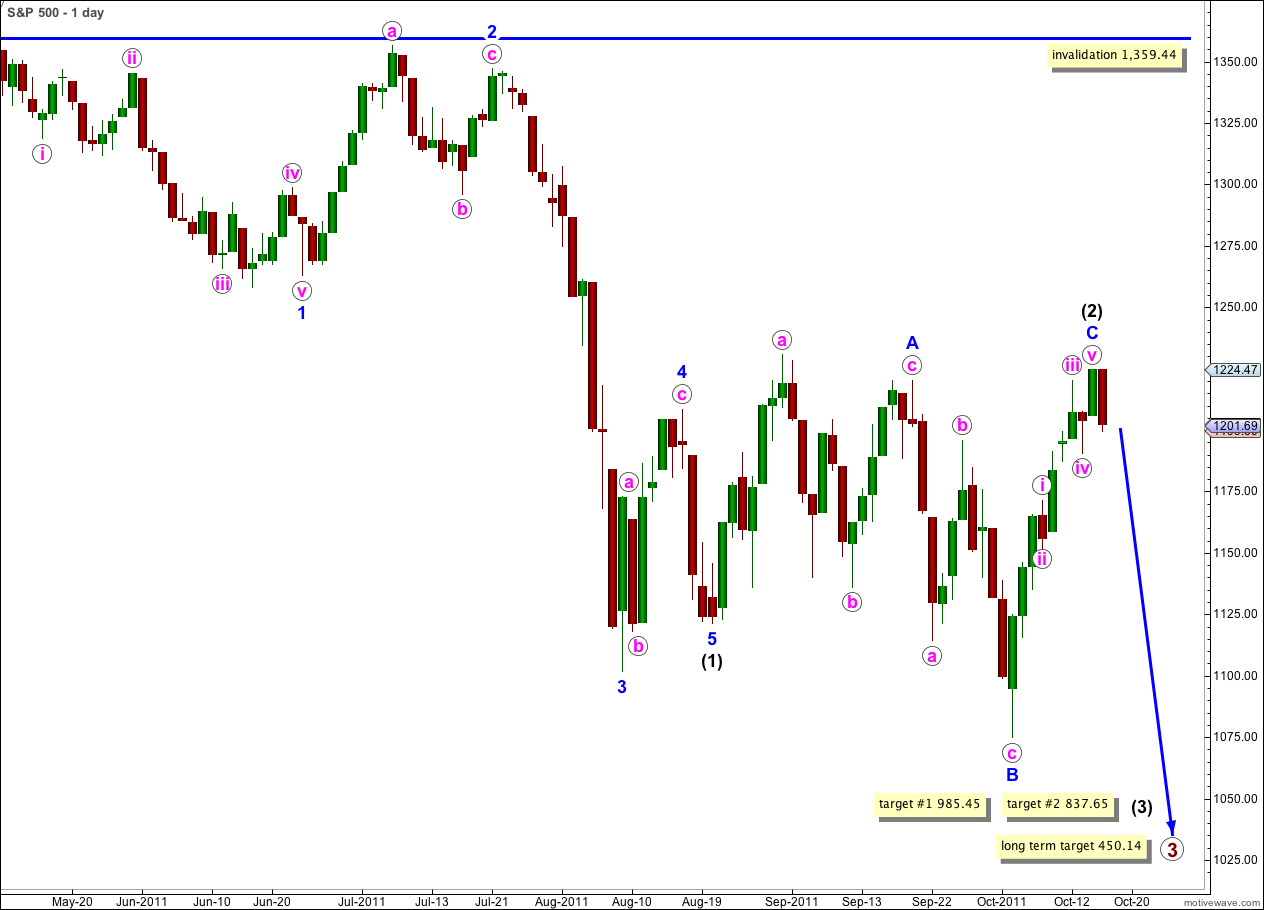
Last analysis expected a little further upwards movement but Monday’s session has moved only lower. We may have seen the very start of wave (3) black, or we may yet see a little further upwards movement before it begins. Wave C blue of wave (2) black has had its parallel channel clearly breached by downwards movement and wave C blue is a complete five wave structure. Therefore, using Elliott’s channeling technique we should expect that we have had a trend change.
At 985.45 wave (3) black would reach equality with wave (1) black. At 837.65 wave (3) black would reach 1.618 the length of wave (1) black. The second lower target may be slightly more likely.
I have two hourly wave counts for us today. Movement below 1,190.58 along with a clear five waves down on the hourly chart would confirm a trend change.
There will remain one other outlying possibility that wave (2) black may continue sideways for another month or so as a double flat or double combination. This alternate idea requires a three wave structure downwards which is unlikely to make a new low below 1,074.77. If downwards movement lacks momentum and unfolds as a three then we must consider this possibility. At this stage wave (2) black is nicely in proportion to wave (1) black and this alternate scenario is unlikely.
Main Hourly Wave Count.
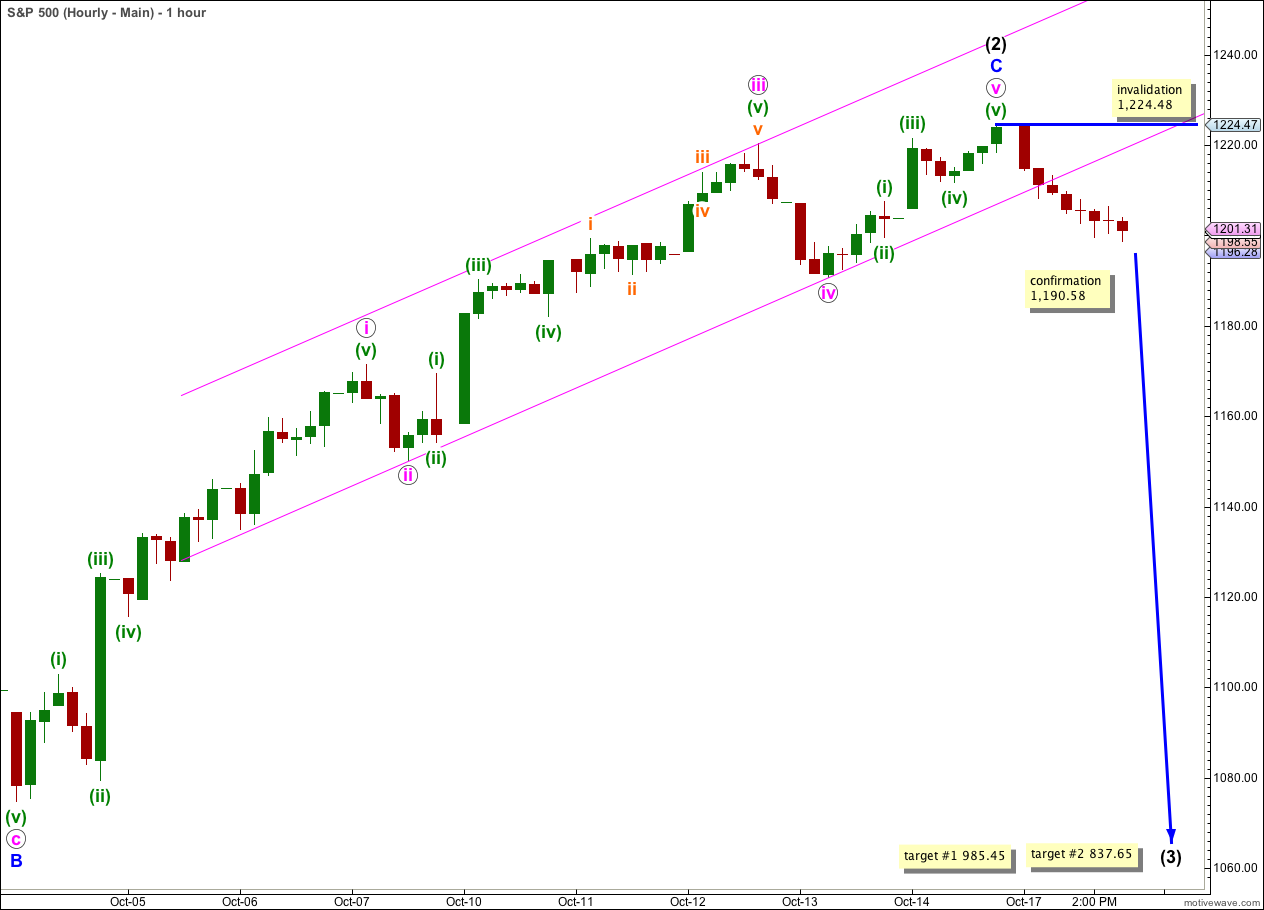
Wave C blue may be seen as a complete five wave structure. Wave C blue is 10.93 points short of 1.618 the length of wave A blue.
Ratios within wave C blue are: wave iii pink has no Fibonacci ratio to wave i pink, and wave v pink is 3.01 points short of 0.382 the length of wave i pink.
Ratios within wave v pink are: wave (iii) green has no Fibonacci ratio to wave (i) green, and wave (v) green is 0.82 points short of 0.618 the length of wave (iii) green.
The parallel channel drawn here is Elliott’s technique. We have a very clear channel breach indicating a trend change.
When we have movement below 1,190.58 the probability that we have had a trend change will increase.
A clear five wave structure downwards on the hourly chart will provide further confidence in this trend change.
Within wave (3) black no second wave correction may move beyond the start of its first wave. This wave count is invalidated with movement above 1,224.48.
Alternate Hourly Wave Count.
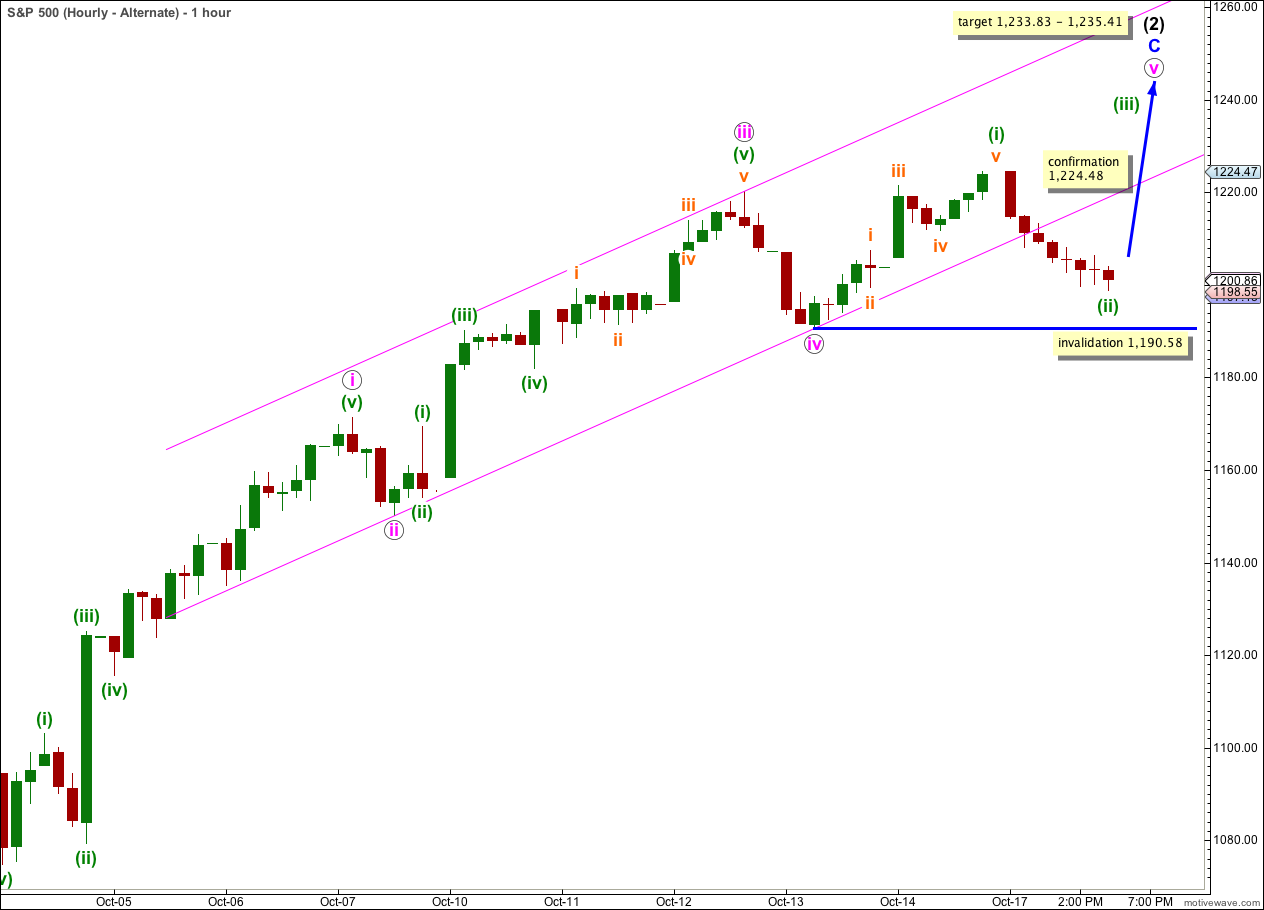
It is possible that only wave (i) green within wave v pink is complete.
This alternate is possible, but it has a strange look in that it is not fitting within the trend channel.
Wave (ii) green may not move beyond the start of wave (i) green. This wave count would be invalidated with movement below 1,190.58.
Movement above 1,224.48 would confirm this wave count. At that stage we should expect price to go a little higher before a big trend change.
At 1,235.41 wave C blue would reach 1.618 the length of wave A blue.
At 1,233.83 wave v pink would reach 0.618 the length of wave iii pink.