
Elliott Wave chart analysis for the S&P 500 for 14th October, 2011. Please click on the charts below to enlarge.
Movement above 1,220.25 within the first half hour of Friday’s session invalidated our main and alternate wave counts. This upwards movement is most likely wave (2) black continuing. The alternate possibility which saw a series of overlapping first and second waves is now invalidated.
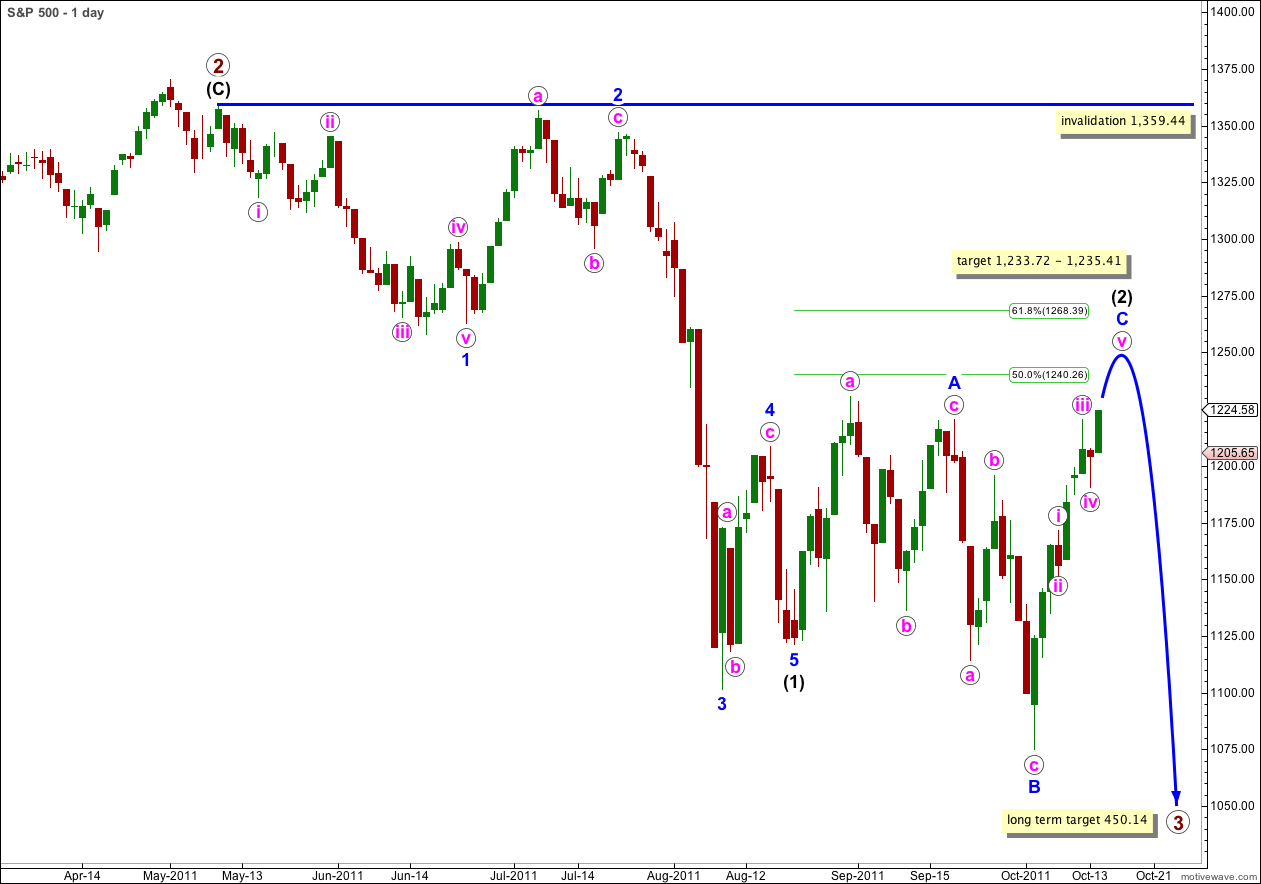
With wave C blue moving beyond the end of wave A blue a rare running flat for wave (2) black is now avoided. At 1,235.41 (the upper edge of our target zone) wave C blue would reach 1.618 the length of wave A blue and wave (2) black would have a typical expanded flat look and structure. In two more trading days wave C blue would have lasted a Fibonacci 13 days.
Movement above 1,230.71 (the high of wave a pink within wave A blue of wave (2) black) is very likely and would ensure that wave (2) black has a better overall look as a flat correction.
Wave (2) black may not move beyond the start of wave (1) black. This wave count is invalidated with movement above 1,359.44.
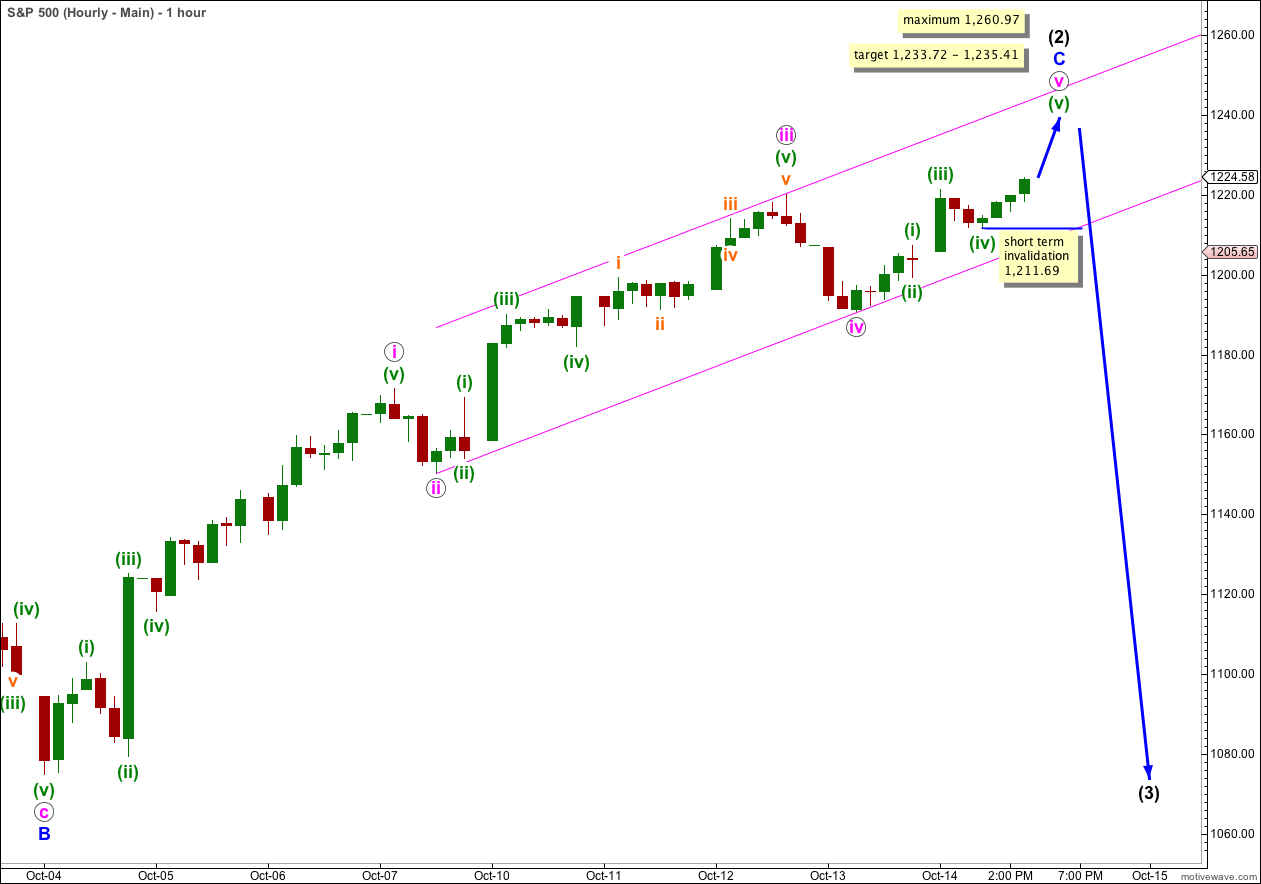
The structure of wave C blue is almost complete.
The reason for the invalidation was an incorrect analysis of the third wave within wave C blue: the end of it was incorrectly labeled.
Ratios within wave iii pink are: wave (iii) green has no Fibonacci ratio to wave (i) green, and wave (v) green is 2.28 points longer than equality with wave (iii) green.
There is still no Fibonacci ratio between waves i and iii pink which means that we shall more than likely see a Fibonacci ratio between wave v pink and either of i or iii pink. At 1,233.83 wave v pink would reach 0.618 the length of wave iii pink. This is within our target zone.
Because wave iii pink is shorter in length than wave i pink this limits wave v pink. Wave iii may not be the shortest wave and wave v pink has a maximum length at equality with wave iii pink at 1,260.97.
Within wave v pink wave (iii) green has no Fibonacci ratio to wave (i) green which means it is more than likely we shall see a Fibonacci ratio between wave (v) green and either of waves (i) or (iii) green. At 1,233.72 wave (v) green would reach equality with wave (iii) green. This is the lower edge of our target zone.
The target zone is a small 1.69 point zone calculated on three degrees of labeling. It has a high probability.
I have redrawn the trend channel about wave C blue using Elliott’s second technique. Draw this channel from the lows of ii to iv pink and place a parallel copy on the high of iii pink. Expect wave v pink to end most likely mid way in this channel. We may use the channel as indication that wave C blue is over when we have a good one or two candlesticks below and not touching the channel.
Upwards movement has very little more to go. It may end on Monday or in one to two more trading days.