
Elliott Wave chart analysis for the S&P 500 for 12th October, 2011. Please click on the charts below to enlarge.
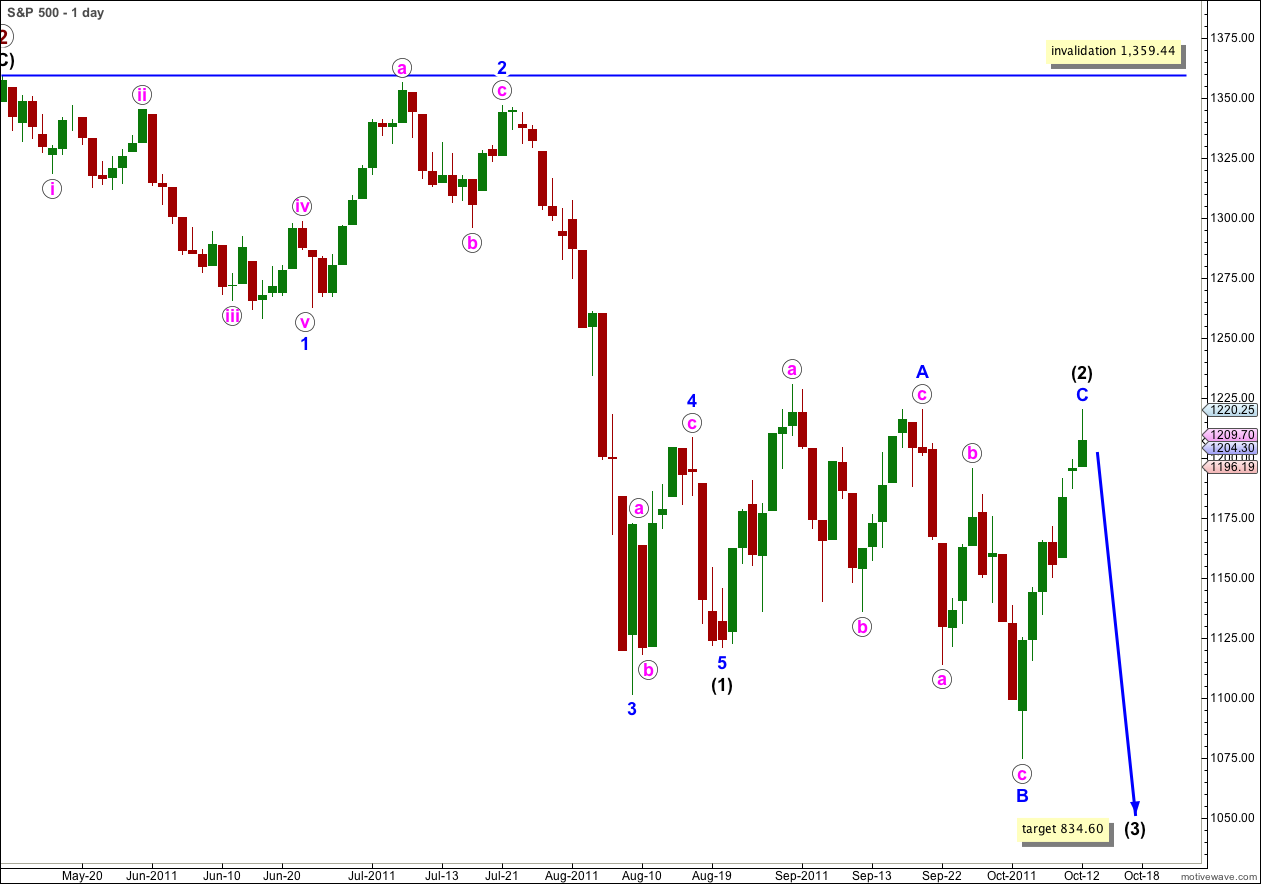
We may have had a trend change during Wednesday’s session, but this is unconfirmed. If this is the case then wave (2) black was a very rare running flat correction. This is possible if the downwards pressure is strong enough. I have an alternate possibility at the end of this analysis, and it also expects further downwards movement.
At 834.60 wave (3) black would reach 1.618 the length of wave (1) black.
Until the trend change is confirmed we must leave the invalidation point at the start of wave (1) black. Any further upwards movement of wave (2) black may not move beyond the start of wave (1) black.
Main Hourly Wave Count.
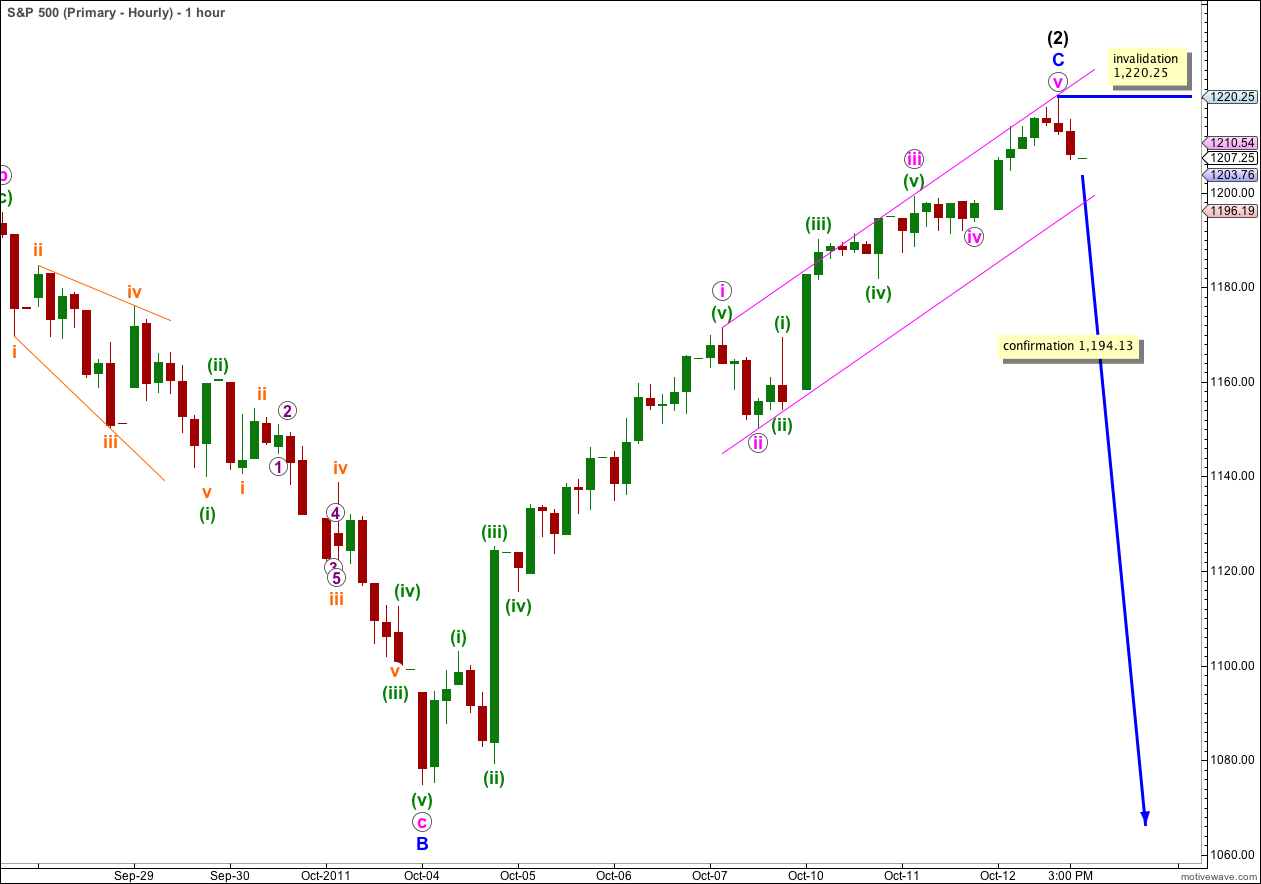
Wave C blue to end the flat for wave (2) black is now a complete five wave structure. The barrier triangle for wave iv pink remained valid and the subsequent upwards movement was relatively short. There are no Fibonacci ratios between waves i, iii, and v pink.
A parallel channel drawn about the impulse for C blue using Elliott’s technique shows perfectly where wave v pink may have ended. When we have movement below this channel then we shall have trend channel confirmation of this trend change.
Movement below 1,194.13 would invalidate the alternate hourly chart below and so provide further confirmation of a trend change.
If this wave count is correct then tomorrow we should see an increase in downwards momentum as a third wave of a third wave begins.
Alternate Hourly Wave Count.
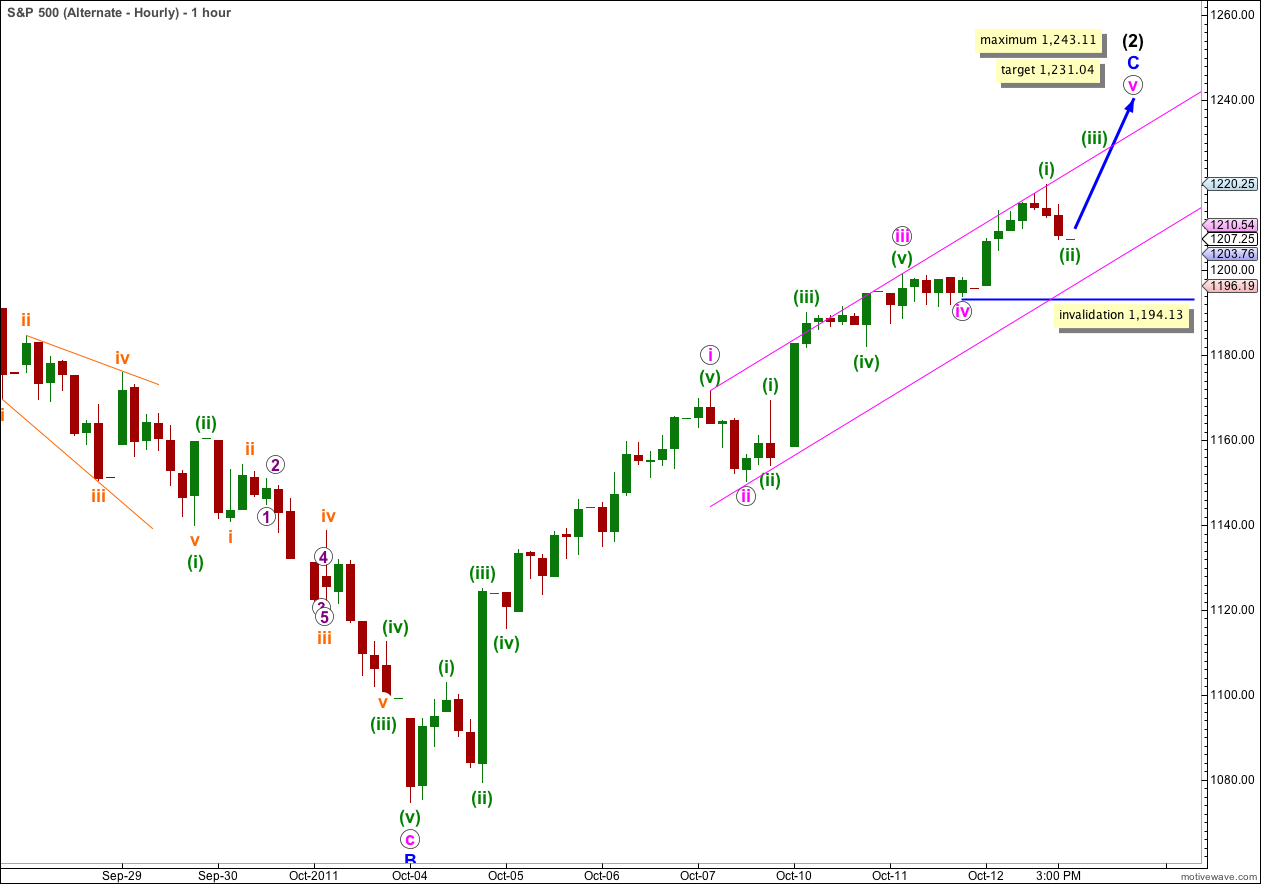
It is also possible that only wave (i) green within wave v pink is complete.
Wave (ii) green may not move beyond the start of wave (i) green. This wave count is invalidated with movement below 1,194.13.
If we see a new high tomorrow then wave v pink is obviously not over. It may not however be longer than equality with wave iii pink because wave iii pink may not be the shortest wave. Wave v pink is limited to no higher than 1,243.11.
At 1,231.04 wave v pink would reach 0.382 the length of wave i pink. This would be our target for upwards movement to end if we see a new high tomorrow.
Alternate Daily Wave Count.
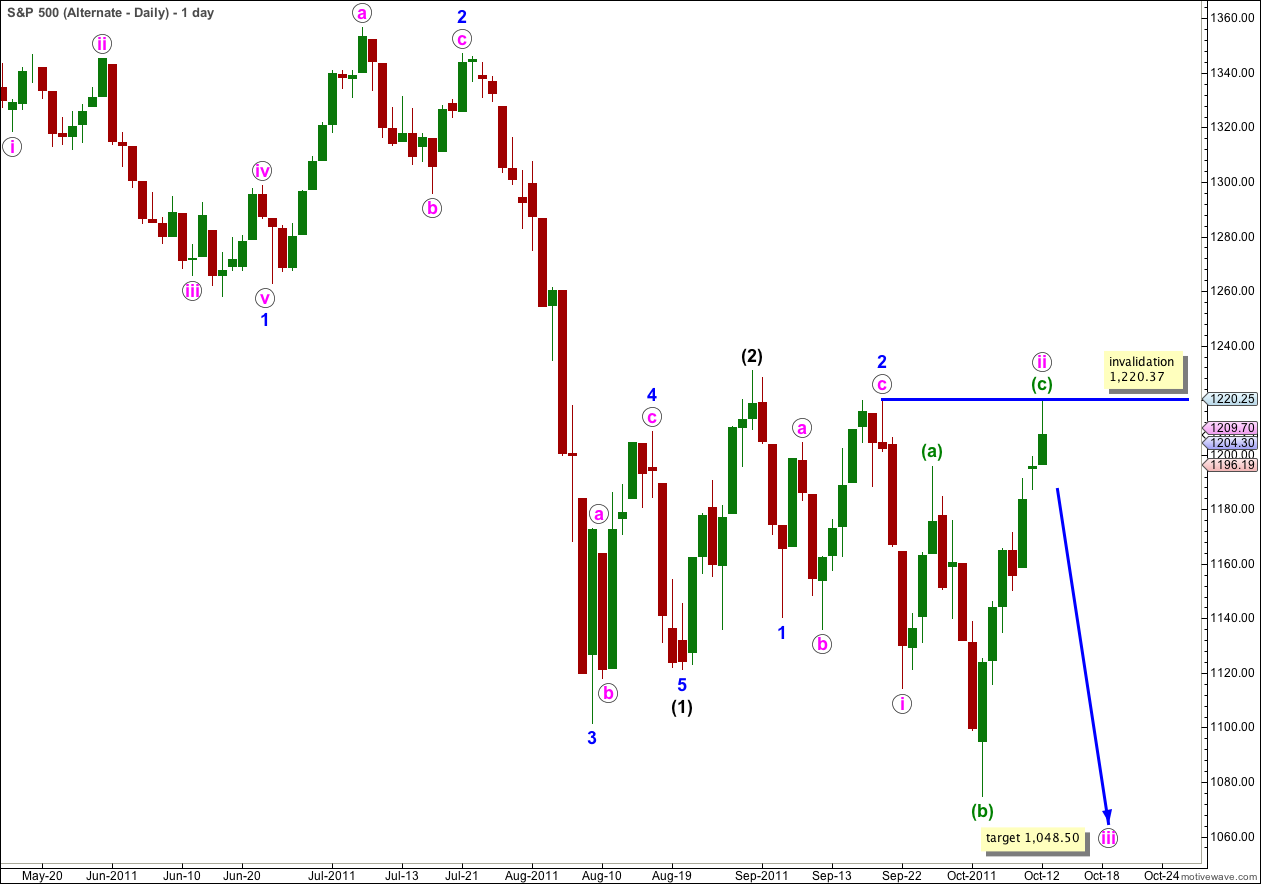
It is possible that we have seen a series of first and second wave corrections. Each second wave correction is extremely deep.
If this is the case then the next downwards movement could be especially violent.
Any further upwards movement of wave ii pink may not move beyond the start of wave i pink. This wave count is invalidated with movement above 1,220.37.
This alternate wave count avoids truncations and running flats, but the size of waves i and ii pink look a bit too large in duration for minute degree waves.
At 1,048.50 wave iii pink would reach 1.618 the length of wave i pink.
There is no divergence in our expectations of imminent downwards movement between this alternate and our main wave count. They will however diverge in the future, and I will continue to consider this as an alternate until one or the other is invalidated.