
Elliott Wave chart analysis for the S&P 500 for 11th October, 2011. Please click on the charts below to enlarge.
Movement above 1,195.86 invalidated the leading diagonal structure on our main wave count, and confirmed our alternate.
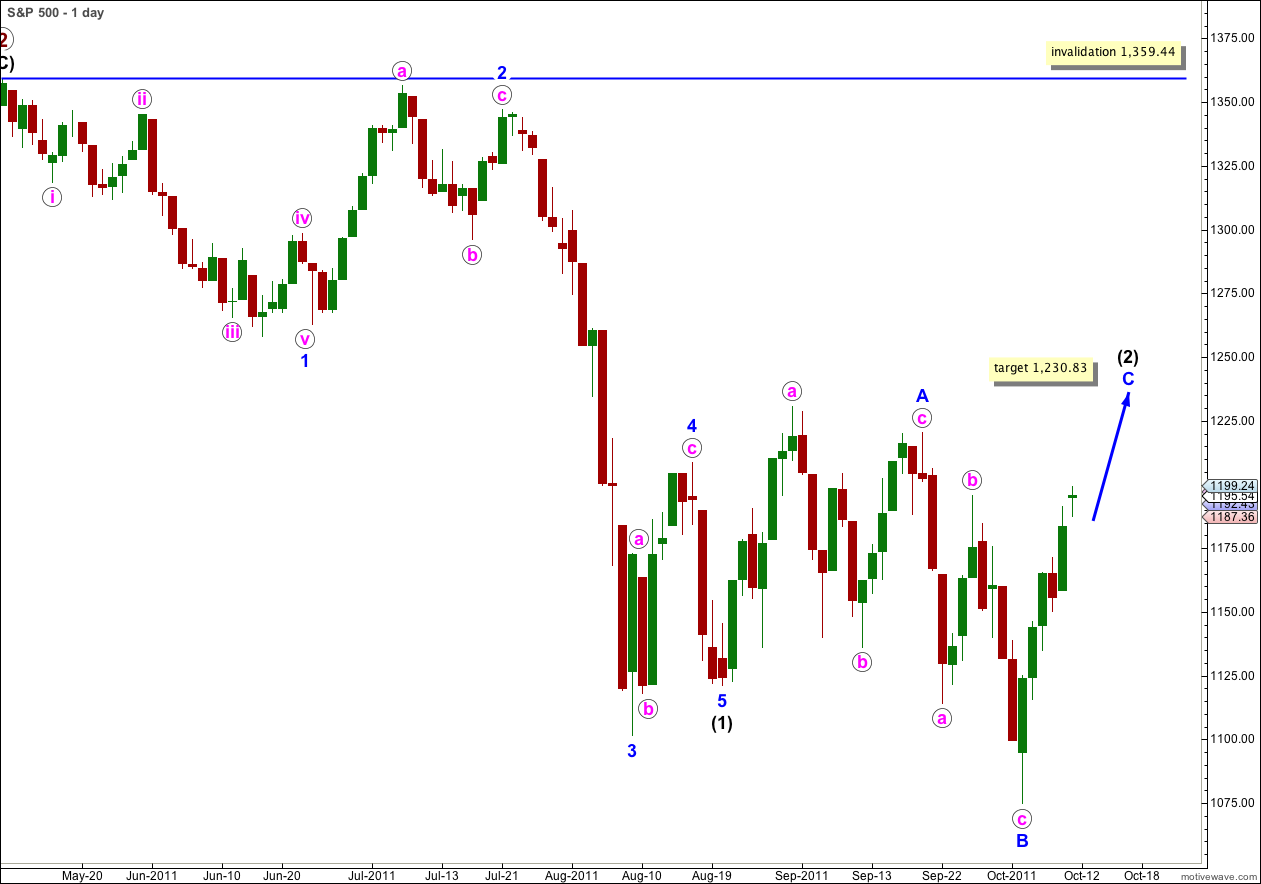
This wave count sees wave (2) black as continuing as an expanded flat correction. If this is correct then the probability that wave C blue would move above the end of wave A blue at 1,220.37 is very high. Failure of wave C to end beyond the end of A would see a truncation and a very rare running flat correction.
Wave C blue must subdivide into a five wave structure and wave i pink is an impulse, and wave C blue is likely to be an impulse.
At 1,235.41 wave C blue would reach 1.618 the length of wave A blue.
Wave (2) black may not move beyond the start of wave (1) black. This wave count is invalidated with movement above 1,359.44.
I have reanalysed the wave down labeled c pink of B blue. It may be seen as a five wave impulse.
Within wave B blue there is no Fibonacci ratio between waves a and c pink.
Ratios within wave c pink are: wave iii green is 2.5 points longer than equality with wave i pink, and wave v pink is 1.67 points longer than 0.618 the length of wave iii pink.
Ratios within wave iii green of wave c pink are: wave iii orange is 1.15 points longer than 1.618 the length of wave i orange, and there is no Fibonacci ratio between wave v orange and either of i or iii orange.
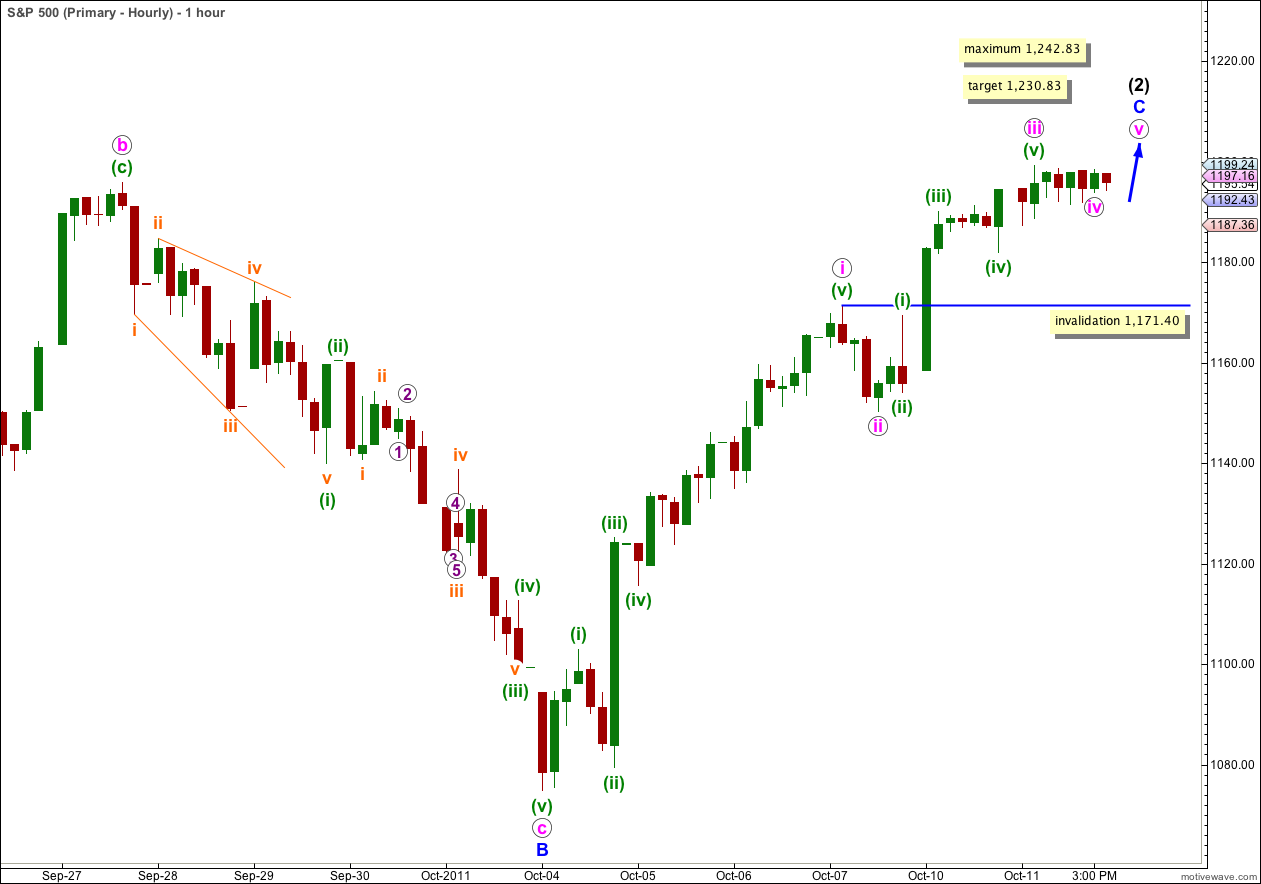
Wave C blue must subdivide into a five wave structure. Wave iii pink has no Fibonacci ratio to wave i pink and it is more likely that wave v pink will exhibit a Fibonacci ratio to either of i or iii pink. At 1,230.76 wave v pink would reach about 0.382 the length of wave i pink. Because wave iii pink is shorter than wave i pink this limits the length of wave v pink. If wave iv pink does not move lower than the limit to wave v pink is at 1,242.83
Within wave C blue ratios within wave i pink are: wave (iii) green is just 0.2 points longer than 1.618 the length of wave (i) green, and there is no Fibonacci ratio between wave (v) green and either of (i) or (iii) green.
Ratios within wave iii pink of wave C blue are: wave (iii) green has no Fibonacci ratio to wave (i) green, and wave (v) green is 1.84 points short of equality with wave (i) green.
Wave iv pink may be unfolding as either a triangle (more likely) of a double flat.
Wave iv pink looks most like a barrier triangle on the 5 minute chart. Following a barrier triangle in a fourth wave position we should expect either a short sharp thrust upwards, or a long extended fifth wave. A short sharp fifth wave seems most likely as it may not be extended because the third wave may not be the shortest.
Prior to the completion of the fifth wave upwards any further downwards movement of wave iv pink may not move into wave i pink price territory. This wave count is invalidated in the short term with movement below 1,171.40.