
Elliott Wave chart analysis for the S&P 500 for 10th October, 2011. Please click on the charts below to enlarge.
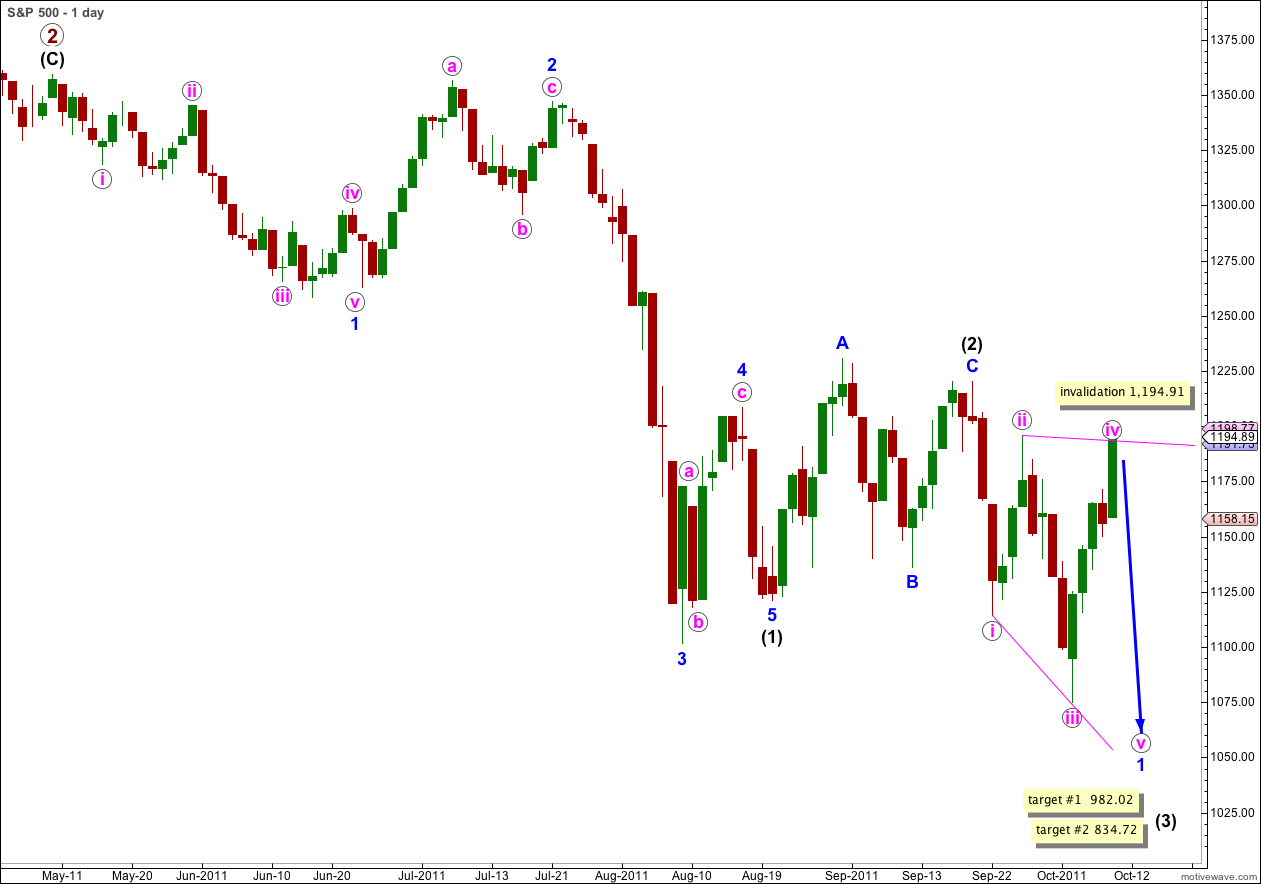
Unexpected upwards movement has invalidated our hourly wave count. The leading diagonal structure remains valid, but only just. This has prompted me to look again for a possible alternate if the diagonal is invalidated and this is presented at the end of this analysis.
The diagonal has a strong expanding look and wave iv pink now is a clear three wave structure on the daily chart. I have moved the invalidation point on the daily chart lower. Movement above 1,194.91 would invalidate the diagonal structure. At that stage we should use the alternate below.
A leading diagonal may not have a truncated fifth wave. This wave count expects to see a new low below 1,074.77.
If the diagonal remains valid then we shall expect a very deep second wave correction to follow it.
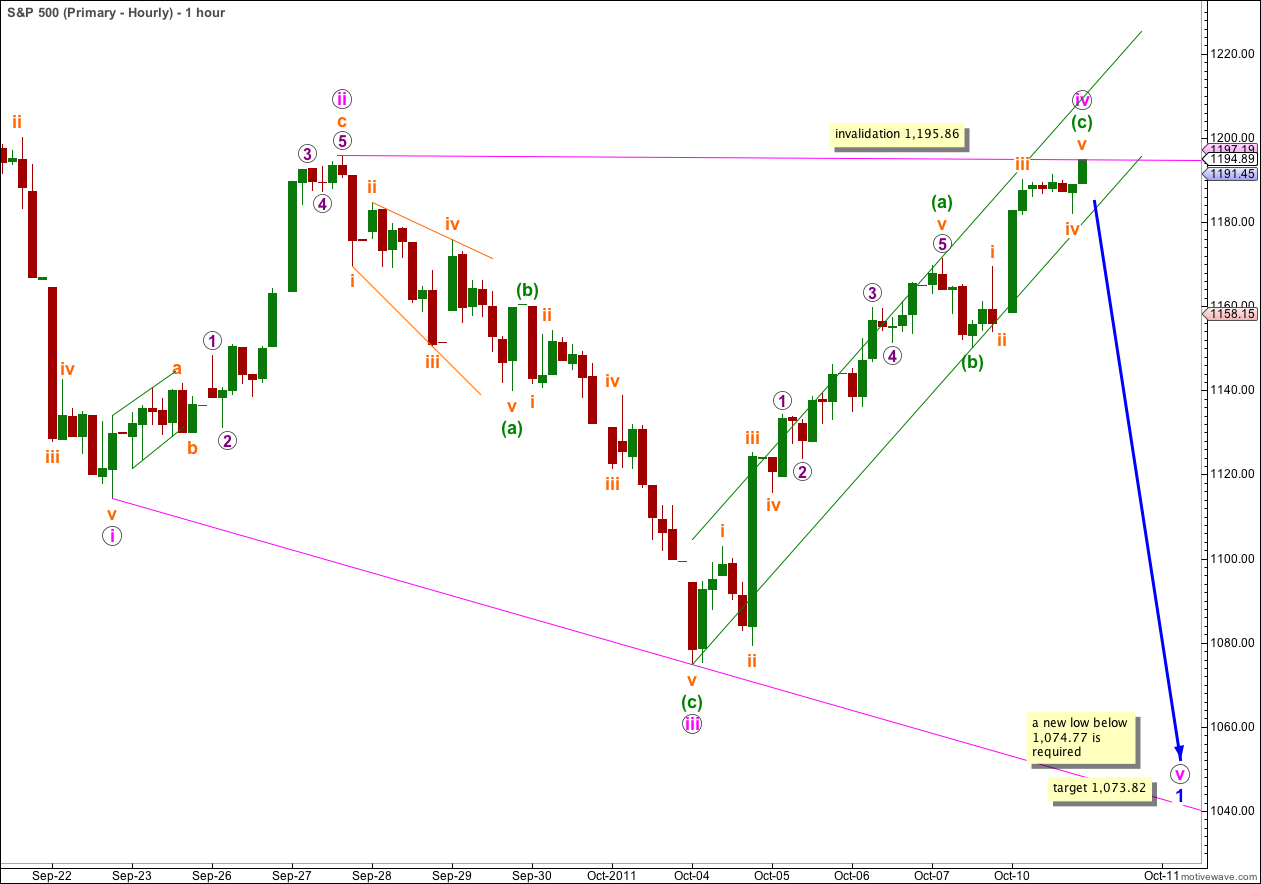
My analysis of the downwards movement labeled (b) green was incorrect. This movement can only have been a zigzag and not an impulse.
Within wave iv pink there remains almost no further room for upwards movement. The invalidation point is very close by at 1,195.86, and wave iv of a diagonal may not move beyond the end of wave ii.
There is no Fibonacci ratio between waves (c) and (a) green within wave iv pink.
Ratios within wave (a) green are: wave iii orange is just 0.2 points longer than 1.618 the length of wave i orange, and there is no Fibonacci ratio between wave v orange and either of i or iii orange.
Ratios within wave (c) green are: wave iii orange has no Fibonacci ratio to wave i orange, and wave v orange is just 0.27 points short of 0.382 the length of wave iii orange.
If this wave count is correct then we must see downwards movement from here tomorrow. A breach of the parallel channel containing wave iv pink zigzag would indicate a trend change.
Wave v pink is likely to be a zigzag and it must make a new low below 1,074.77. At 1,073.82 wave v pink would reach equality in length with wave iii pink which would be expected as the diagonal is expanding.
Alternate Daily Wave Count.
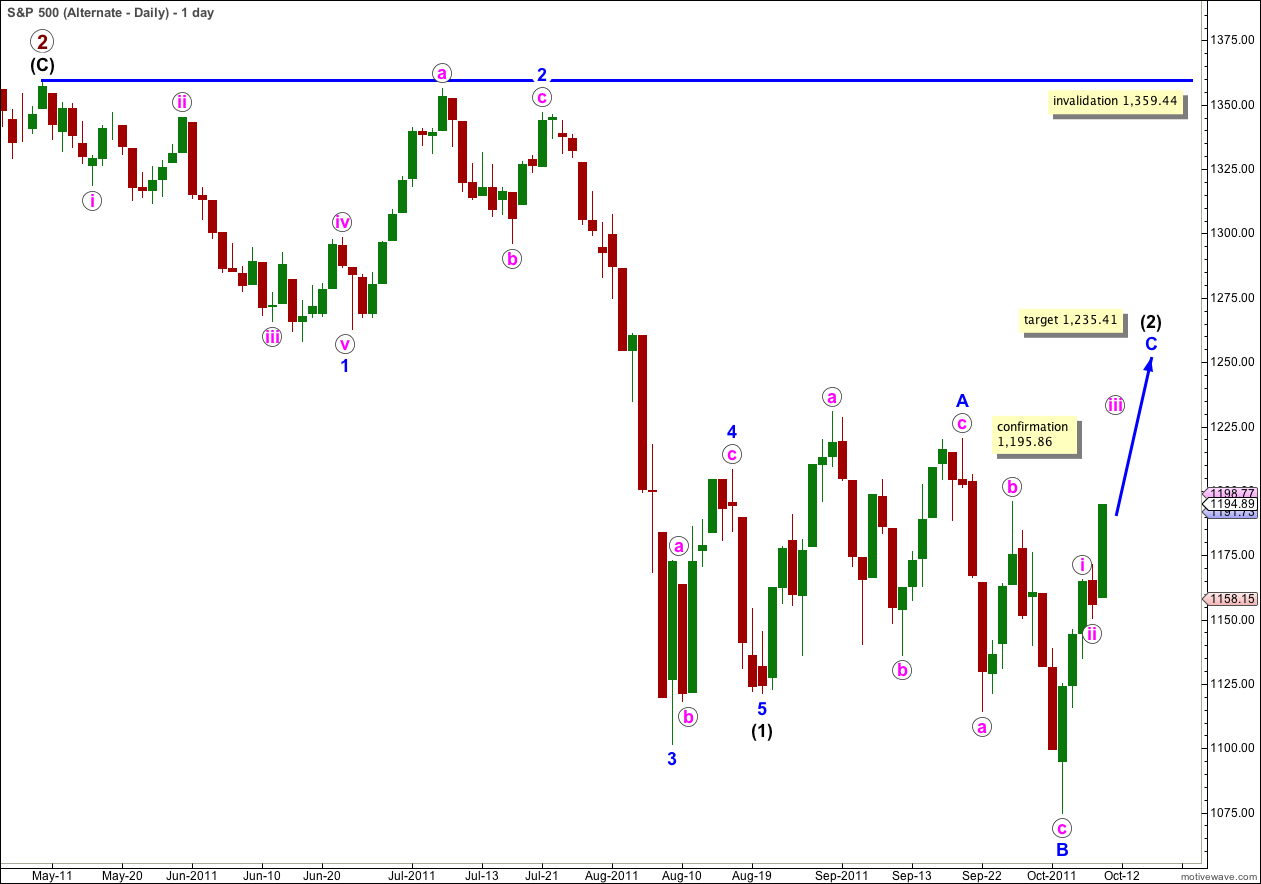
At this stage this is the best alternate that I can see.
If price moves above 1,195.86 tomorrow then we should expect it to keep rising to about 1,235.41.
This wave count sees wave (2) black as continuing as an expanded flat correction. If this is correct then the probability that wave C blue would move above the end of wave A blue at 1,220.37 is very high. Failure of wave C to end beyond the end of A would see a truncation and a very rare running flat correction.
Wave C blue must subdivide into a five wave structure and wave i pink is an impulse, so wave C blue is likely to be an impulse.
A-B-C and 1-2-3 look and behave essentially the same. The hourly chart is counting upwards movement as A-B-C, this alternate would have the same subdivisions except it would be labeled 1-2-3.
At 1,235.41 wave C blue would reach 1.618 the length of wave A blue.
This wave count must see the downwards wave labeled c pink of B blue as a five wave structure. I think it looks best as a zigzag, and for this reason