
Elliott Wave chart analysis for the S&P 500 for 7th October, 2011. Please click on the charts below to enlarge.
The S&P 500 moved very slightly higher to begin Friday’s session, which we had allowed for, before turning downwards and ending with a deep correction.
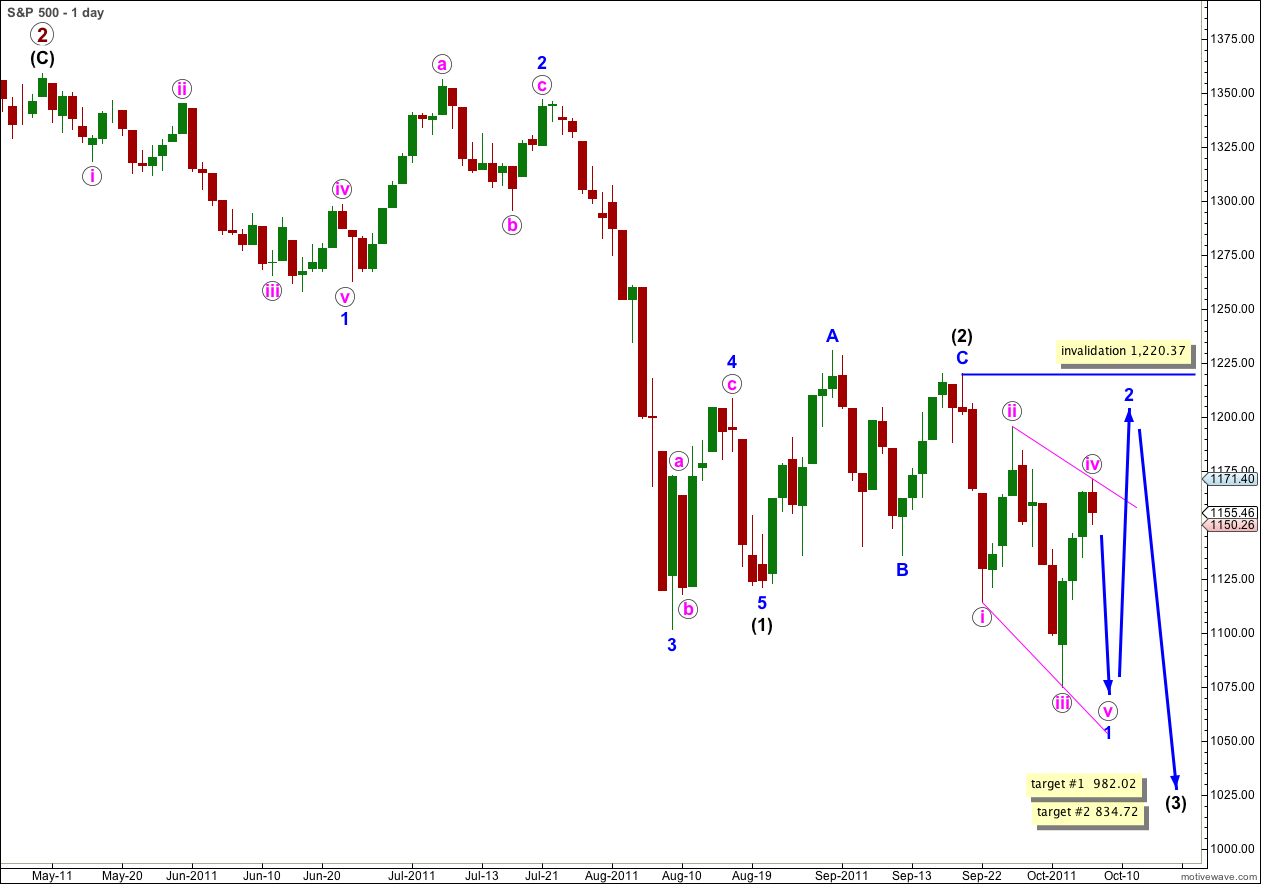
The leading diagonal for wave 1 blue within wave (3) black remains valid at this stage. The diagonal is expanding and wave v pink should be longer than wave iii pink if the wave lengths are to be perfect, although our minimum expectation is that it is at least longer than wave i pink, as sometimes third waves within diagonals are still the longest of the actionary waves.
A leading diagonal may not have a truncated fifth wave and it must take price to a new low below 1,074.77.
If the diagonal remains valid then we shall expect a deep second wave correction to follow to about 0.786 of wave 1 blue, and after that we shall expect a very strong and extended wave 3 blue downwards.
Long term targets for wave (3) black remain the same. At 982.02 wave (3) black would reach equality in length with wave (1) black. At 834.72 wave (3) black would reach 1.618 the length of wave (1) black. The second target may have a slightly higher probability.
Wave 2 blue may not move beyond the start of wave 1 blue. This wave count is invalidated with movement above 1,220.37.
At this stage this is our only wave count.
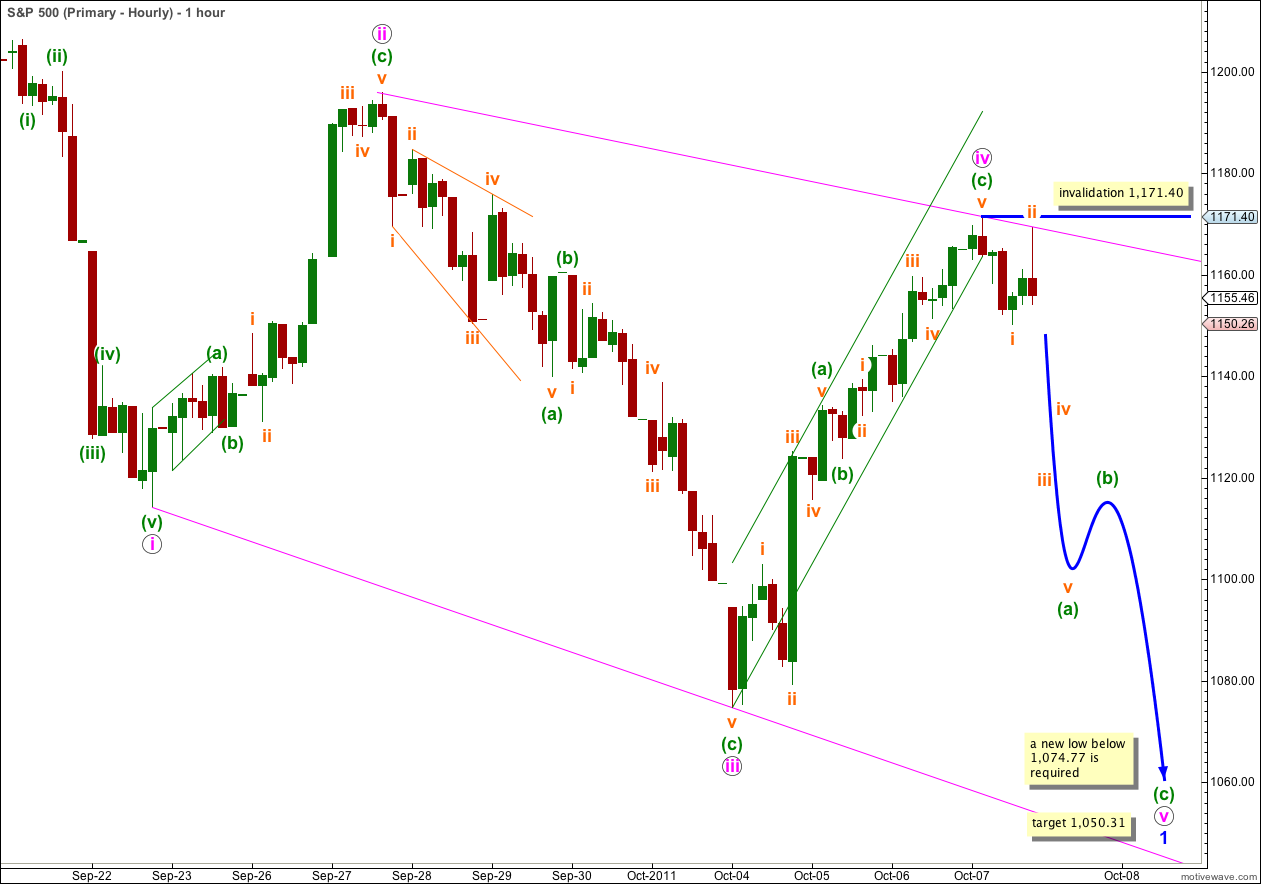
This leading diagonal must see subwaves ii and iv pink as zigzags. Subwaves i, iii, and v pink would most commonly be zigzags but they may also be impulses. Wave iii pink is best seen as a zigzag. We shall expect wave v pink to also most likely be a zigzag.
Wave v pink must make a new low below the end of wave iii pink at 1,074.77.
At 1,050.31 wave v pink would reach equality with wave iii pink and this will be our expectation for the minimum target. When waves (a) and (b) green within wave v pink are complete we may use the ratio between waves (a) and (c) green to calculate a more accurate target.
Within wave iv pink the structure is now complete and movement below 1,151.29 has indicated that wave v orange within wave (c) green will not extend any higher. There is no Fibonacci ratio between waves (a) and (c) green.
Ratios within wave (a) green are: wave iii orange is just 0.2 points longer than 1.618 the length of wave i orange, and wave v orange is just 0.4 points longer than 0.618 the length of wave i orange.
Ratios within wave (c) green are: wave iii orange is 2.32 points longer than 1.618 the length of wave i orange, and wave v orange has no Fibonacci ratio to either of i or iii orange.
The green trend channel drawn about wave iv pink upwards is a best fit. This channel has been clearly breached by downwards movement during Friday’s session and this is further indication that Friday may have seen a trend change to the downside.
Within wave v pink downwards we probably have only wave i orange within wave (a) green complete. This is a clear five wave impulse down on the 5 minute chart.
Wave ii orange upwards which ended Friday’s session is a clear three wave structure on the 5 minute chart. It is probably complete and the very end of Friday’s session probably began wave iii orange within wave (a) green downwards.
If wave ii orange extends any higher as a double zigzag or double combination then it may not move beyond the start of wave i orange. This wave count is invalidated with movement above 1,171.40.
The S&P 500 should move overall downwards for most if not all of next week, to make a new low about the end of the week.
I have considered the possibility that instead of a leading diagonal this is a series of overlapping first and second waves. The problem with such an alternate is that the downwards waves labeled here pink i and iii must be seen as impulses. Wave iii pink has a corrective wave count, and if my analysis of this piece of movement is correct then we may rule out another first wave in that position.
If the downwards movement that we expect to see next week is very strong and MACD shows a significant increase in momentum then I will consider this possibility. At this stage please just be aware of it as an outlying alternate, but I consider it unlikely.
I will also keep in mind Daneric’s wave count which sees wave 5 blue completing wave (1) black downwards. However, I also onsider this to have a very low probability. My main objection to that wave count is the structure of the downwards wave labeled on our daily chart as 5 blue of (1) black. I do not want to see this as a B wave, and that structure has been detailed here.