
Elliott Wave chart analysis for the S&P 500 for 4th October, 2011. Please click on the charts below to enlarge.
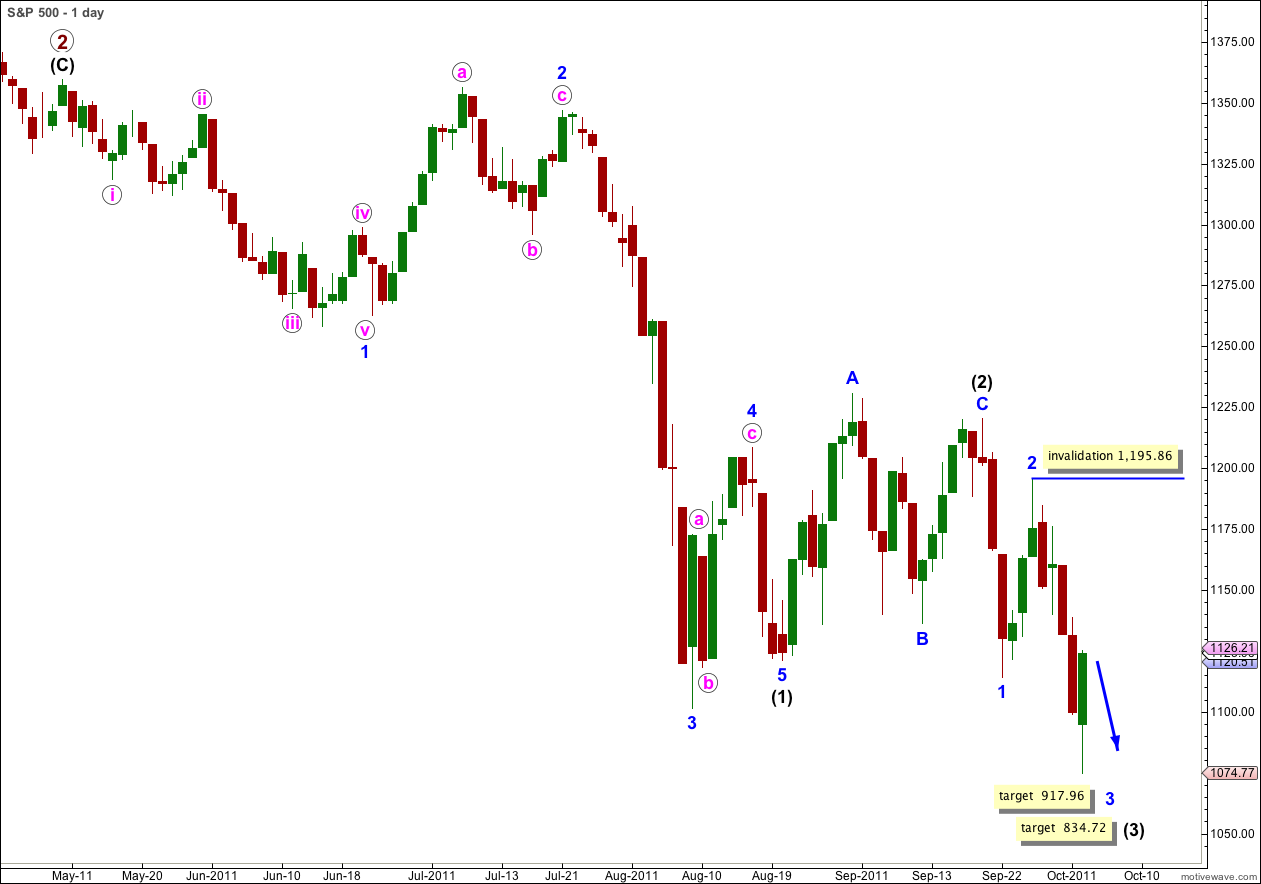
Our short term target for Tuesday’s session was 1,075.84 to 1,070.98. Price reached to 1,074.77 before moving sharply higher in a three wave correction.
The earlier drop of cycle degree wave a was much more sedate in behaviour than what we have seen recently. I think to look for an equivalent we must look to primary wave 1 within cycle wave c, and understand that if this wave count is correct a primary third wave should be more volatile and stronger than the first wave was.
Looking back at primary wave 1 within cycle wave c down we can see some deep corrections within black wave (3) of primary wave 1 towards the beginning. The first second wave correction within intermediate (black) wave (3) was a deep 78% correction. This was followed by another relatively deep 58% correction a few days later.
We are seeing similar volatility here, and we may even expect that along with an increase in downwards momentum that the pendulum will swing also strongly in the opposite direction for corrections. We may not expect this primary third wave to be an easy sheer drop. It looks like volatility will increase and the sharp upwards corrections can be deep and swift too, making analysis harder.
My role will be to pinpoint as accurately as I can where these sharp bounces may start from.
Targets remain the same as previously calculated.
At 917.96 wave 3 blue would reach 2.618 the length of wave 1 blue.
At 834.72 wave (3) black would reach 1.618 the length of wave (1) black.
Within wave 3 blue of wave (3) black wave ii pink may not move beyond the start of wave i pink. This wave count is invalidated with movement above 1,195.86.
Main Wave Count.
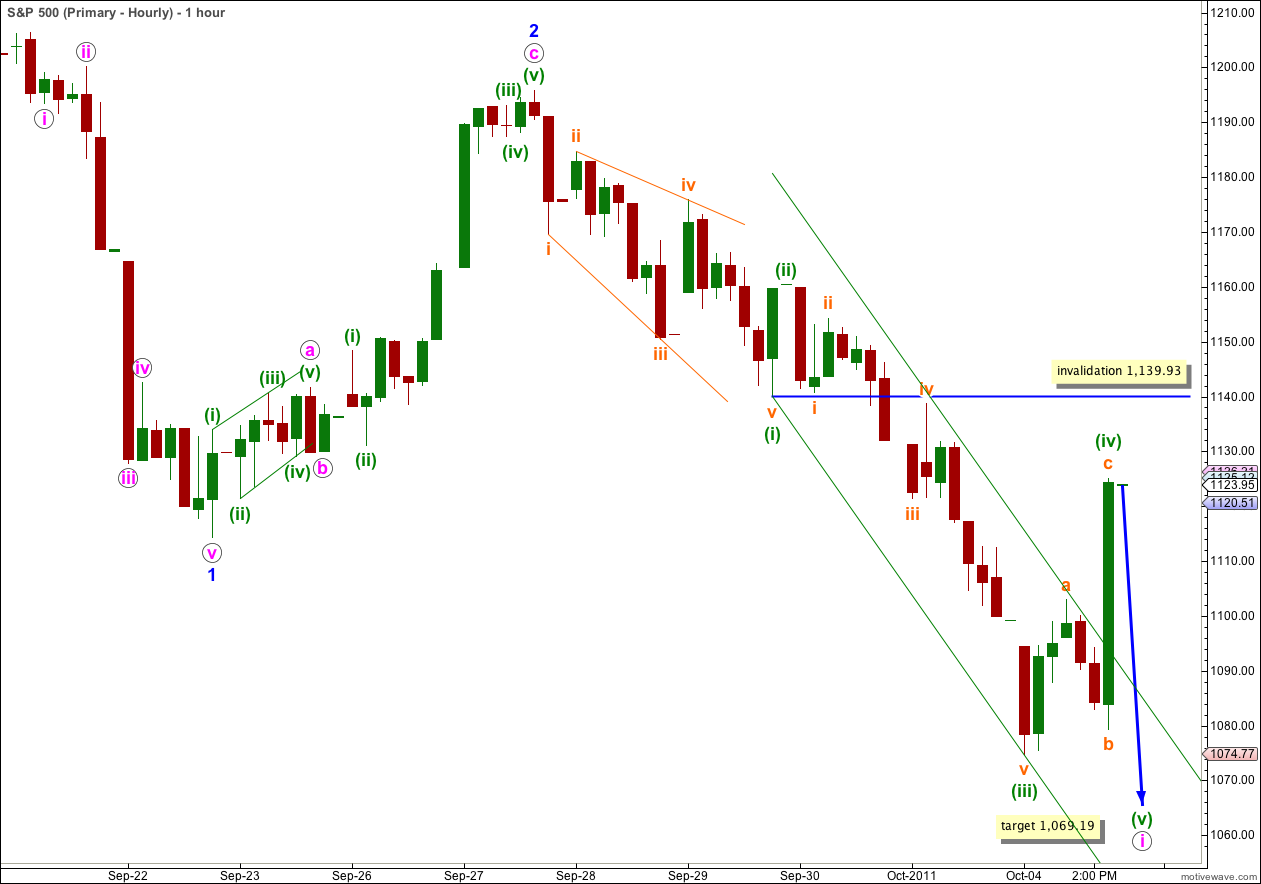
I have moved all recent movement down one degree.
Because wave (iii) green is just 4.91 points short of 1.618 the length of wave (i) green, and has a lower reading on MACD, I expect this was a third wave which ended yesterday. The upwards correction has remained below the end of wave (i) green and so this fits as a fourth wave.
However, MACD has not made a new extreme reading beyond the end of wave 1 blue and I don’t think this was pink waves within wave 3 blue, and we should only be within wave i pink of wave 3 blue still.
Any further upwards movement tomorrow for wave (iv) green may not move into wave (i) green price territory. This wave count is invalidated with movement above 1,139.93.
Wave (v) green would reach equality with wave (i) green at 1,069.19. That would complete wave i pink within wave 3 blue.
This target fits only with the lower targets calculated for waves 3 blue and (3) black, and this is why those waves have only one target each on today’s daily chart.
Wave ii pink to follow may move right up to the start of wave i pink, at that stage the invalidation point must move to where it is on the daily chart.
With recent behaviour exhibiting quite a lot of volatility we must look out for more sharp corrections to come, and wave ii pink could be sharp.
The trend channel drawn here is a best fit. With a fourth wave overshoot we may see wave (v) green also overshoot the channel on the opposite side.
Alternate Wave Count.
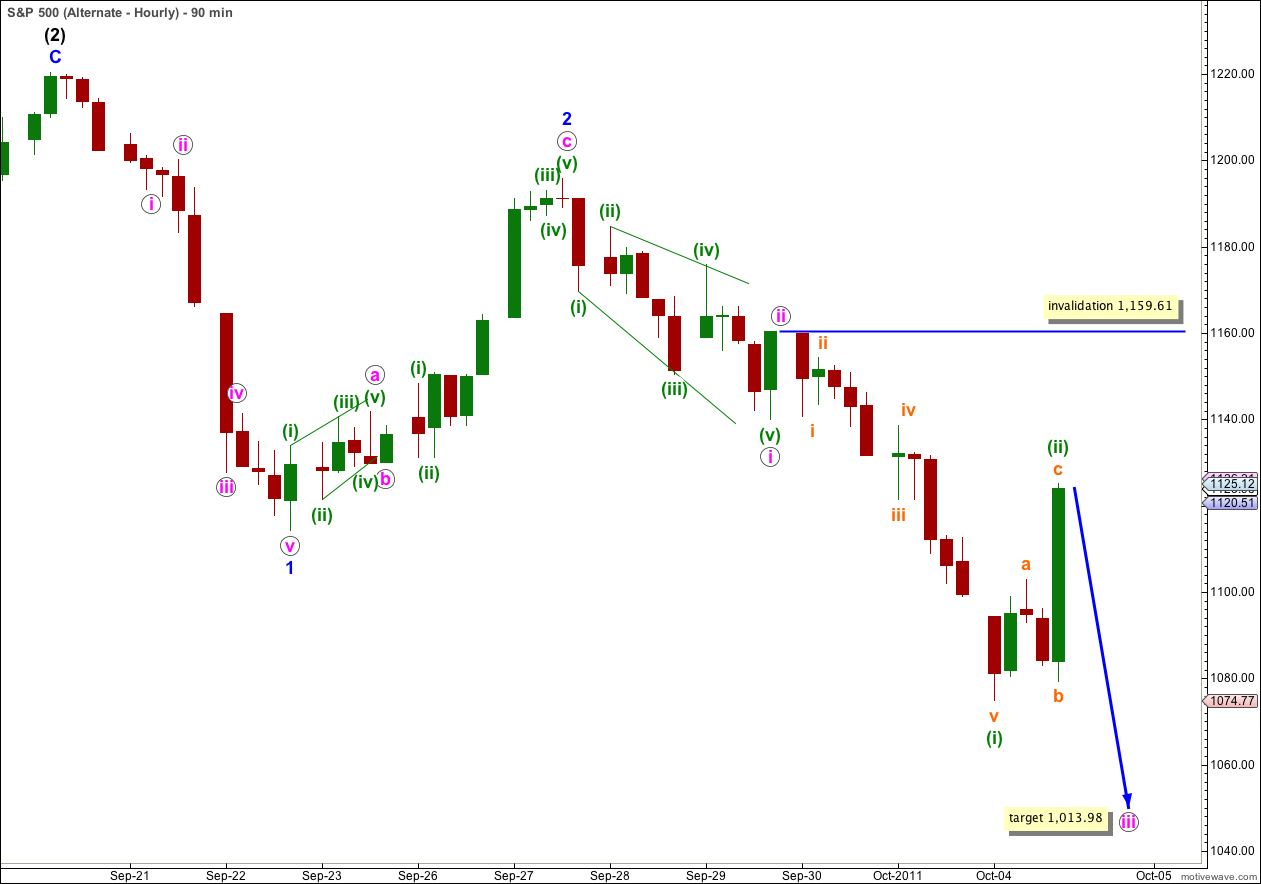
The only variation within a third wave impulse is which wave is extended, and by how much. The only variation in labeling at this stage is which degree to label each piece of downwards movement. I have moved the degree of labeling for the first piece down, the leading diagonal, all up one degree. This also agrees with MACD at this stage.
We have have just seen a series of overlapping first and second waves. Upwards movement which ended Tuesday’s session may have been a second wave correction for wave (ii) green.
Within wave (i) green of wave iii pink there are no Fibonacci ratios between waves i, iii, and v orange.
Within wave (ii) green wave c orange is just 0.2 points longer than 1.618 the length of wave a orange.
At 1,013.98 wave iii pink would reach 2.618 the length of wave i pink.
This hourly wave count expects downwards movement tomorrow. The strongest movement should be about to start tomorrow (or possibly the day after).
For the middle of wave (3) black we would expect to see extreme low readings for MACD. Momentum should increase to the downside.
Wave (ii) green may not move beyond the start of wave (i) green. This wave count is invalidated with movement above 1,159.61.
It is too early to draw a satisfactory trend channel about downwards movement. We may be able to do this in another one or two days.