
Elliott Wave chart analysis for the S&P 500 for 3rd October, 2011. Please click on the charts below to enlarge.
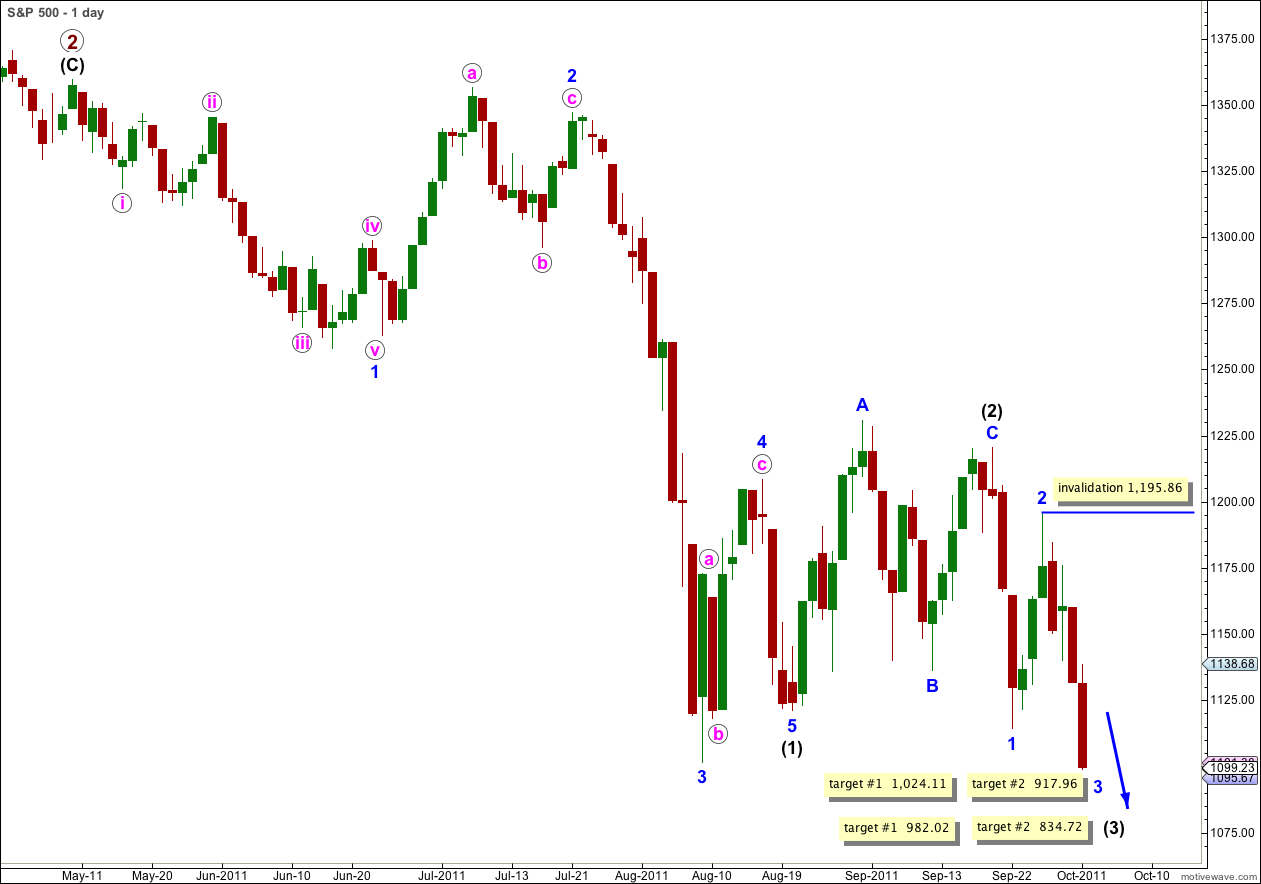
Movement below 1,114.22 invalidated our main daily wave count and confirmed our alternate. This is now our only wave count.
Furthermore, movement to a slightly new low below the price extreme of wave (1) black at 1,101.54 gives more confidence in this wave count.
At 982.02 wave (3) black would reach equality with wave (1) black. At 834.72 wave (3) black would reach 1.618 the length of wave (1) black.
Wave 3 blue within wave (3) black may only subdivide into a simple impulse. The only variation within it is which wave or waves will be extended. At this stage analysis becomes much easier.
At 1,024.11 wave 3 blue would reach 1.618 the length of wave 1 blue. This target fits with both targets for wave (3) black.
At 917.96 wave 3 blue would reach 2.618 the length of wave 1 blue. This target fits only with the second lower target for wave (3) black.
Wave 2 blue was a deep 76.9% correction of wave 1 blue, which was unexpected. It cannot be a flat correction and it must be a zigzag. When wave 4 blue arrives we will expect it to be a shallow correction and most likely either a flat or a triangle.
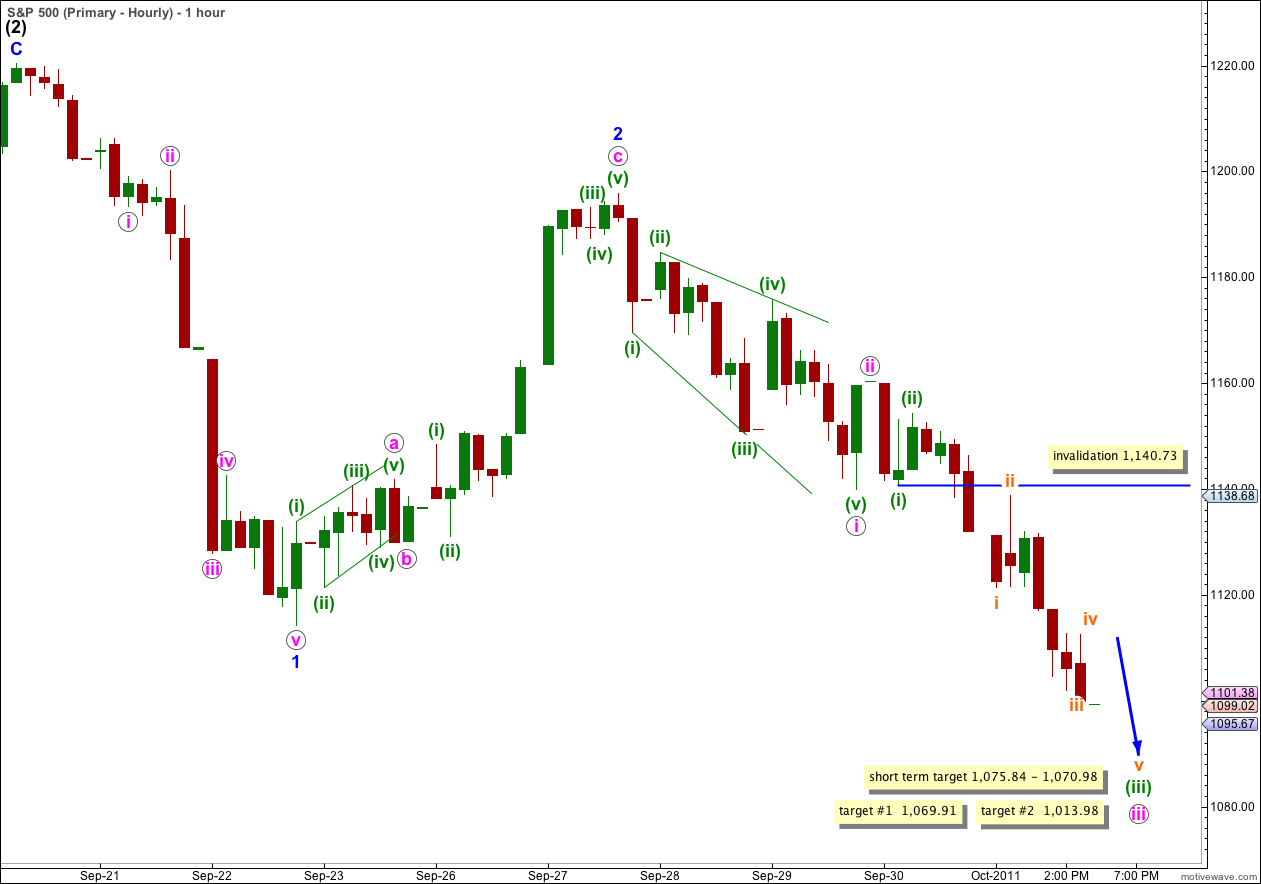
Wave 3 blue has begun with a leading expanding diagonal for wave i pink. Wave ii pink would have been expected to be a deep correction, but it was not.
Within wave (iii) green wave iii orange has no Fibonacci ratio to wave i orange, and wave v orange is more likely to exhibit a Fibonacci ratio to either of i or iii orange.
At 1,075.84 wave v orange would reach equality with wave iii orange.
At 1,070.98 wave (iii) green would reach 4.236 the length of wave (i) green.
This gives us a 4.86 point target zone for tomorrow’s session. About this target we may see a small fourth wave correction which may not move back into wave (i) green price territory above 1,140.73.
Wave (iv) green is fairly likely to end about the fourth wave of one lesser degree at 1,112.55.
Thereafter, wave (v) green downwards should take price lower towards our targets for wave iii pink.
Our targets for wave iii pink may be reached this week, or early next week.
At 1,069.91 wave iii pink would reach 1.618 the length of wave i pink. This target fits with both targets for wave 3 blue on the daily chart.
At 1,013.98 wave iii pink would reach 2.618 the length of wave i pink. This target fits only with the second lower target for wave 3 blue on the daily chart.
Now that the third wave of a third wave of a third wave is confirmed with Monday’s downwards movement we should expect momentum downwards to increase over this week and maybe also next week.