
Elliott Wave chart analysis for the S&P 500 for 30th September, 2011. Please click on the charts below to enlarge.
Historic analysis has been updated. The main wave count is changed to the one we have been using now for a few weeks, and a new alternate has been added.
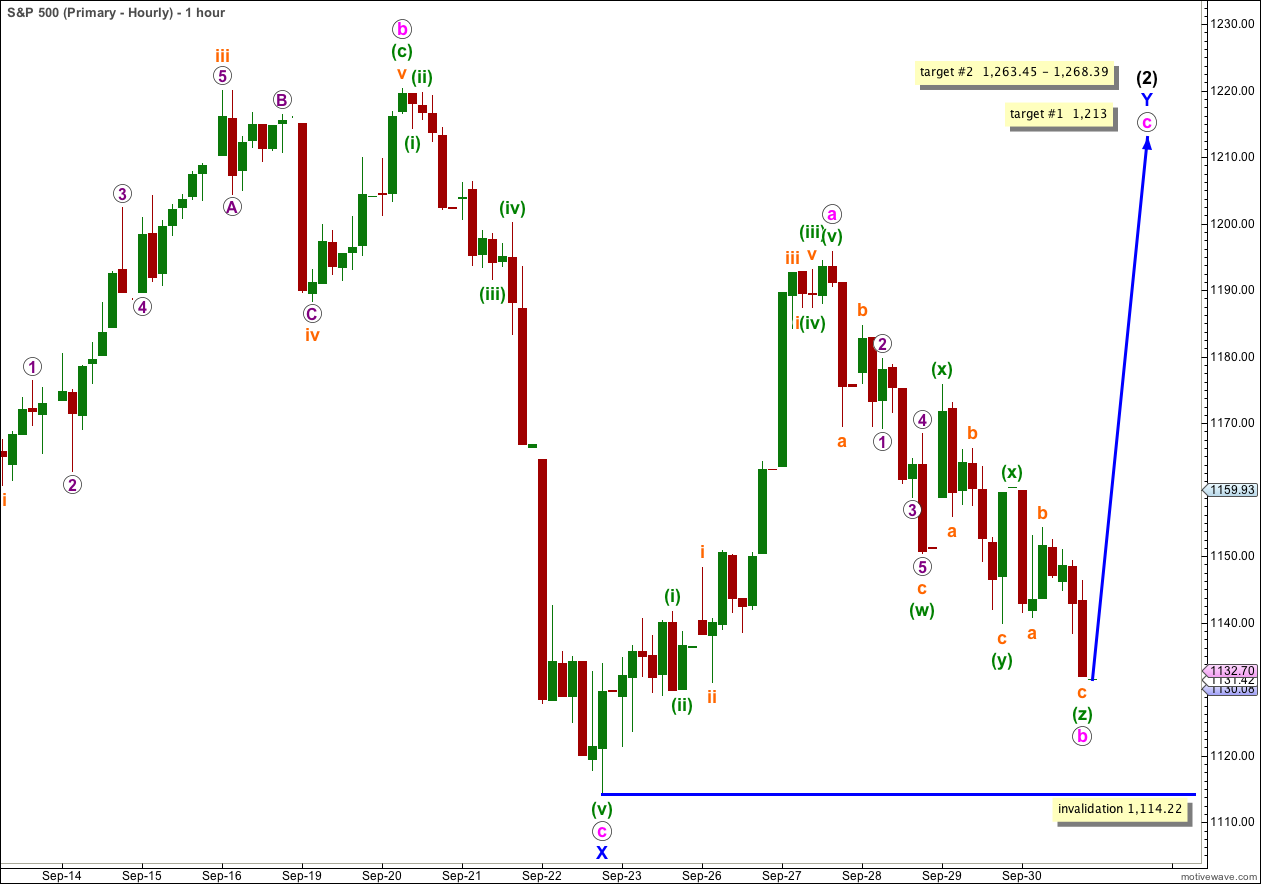
Price moved lower in another zigzag structure, invalidating the main hourly wave count and confirming the (unlikely) alternate.
The problem with rare structures is that we always expect them to not occur, because they rarely do. So when they do turn up it is always from a low probability wave count.
I have looked again at the subdivisions of recent movement to try to find another alternate. This main wave count, and our alternate, are still the two best fits that I can see.
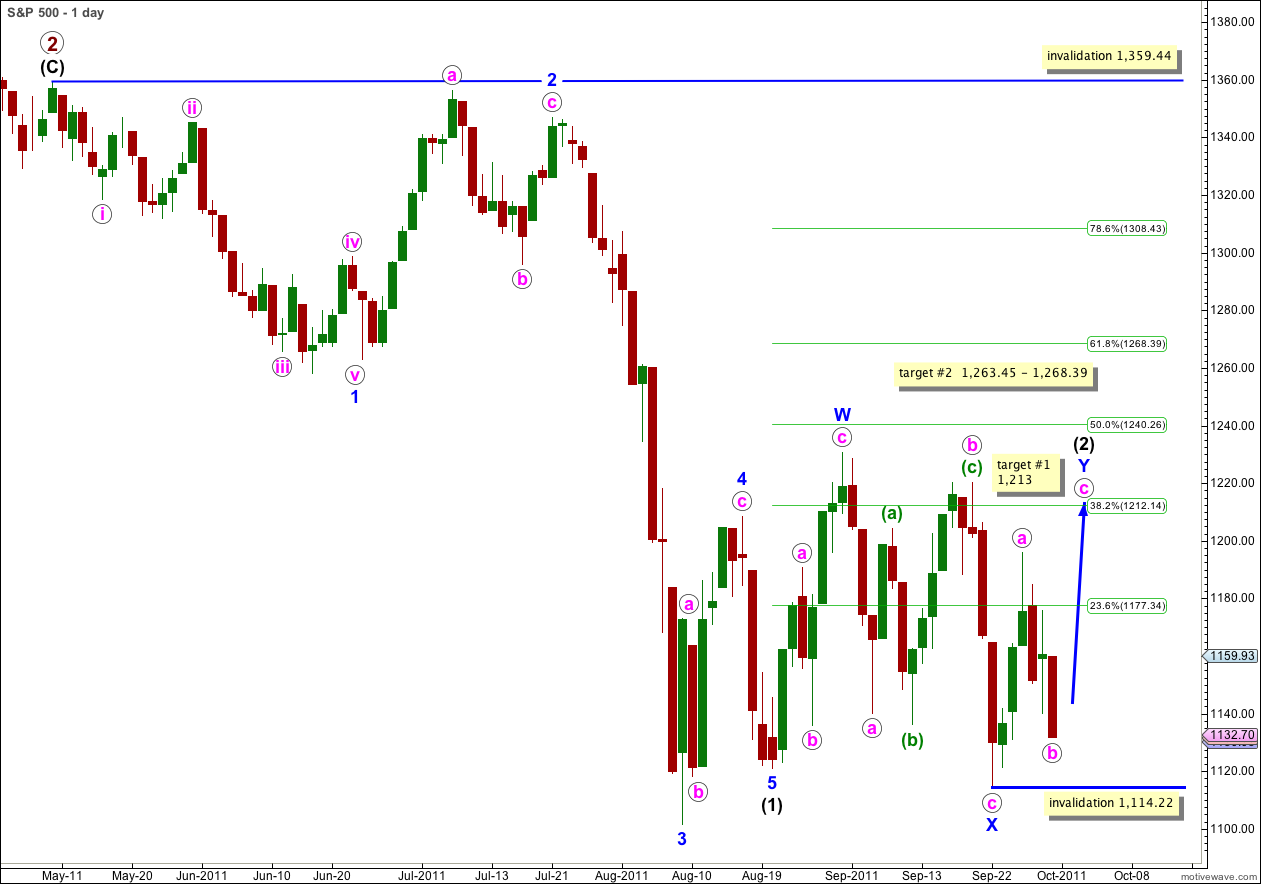
This wave count requires upwards movement to complete a corrective structure for wave Y blue. This is most likely to be a zigzag and we should expect an upwards wave to subdivide into a five, which is most likely to take price above the high of wave a pink at 1,195.86 to avoid a truncation.
At 1,213 wave c pink would reach equality with wave a pink.
At 1,263.45 wave c pink would reach 1.618 the length of wave a pink, and wave Y blue would reach close to the 0.618 Fibonacci ratio of wave (1) black at 1,268.39.
It is possible that wave c pink could complete in only one day, but it seems now unlikely. Wave Y blue will probably last longer than a Fibonacci 8 days. It may take a few more days to complete, possibly up to 5 more days.
Wave (2) black may not move beyond the start of wave (1) black. This wave count is invalidated with movement above 1,359.44.
Main Hourly Wave Count.
Further movement below 1,139.93 invalidated the main hourly wave count confirming this alternate. I have looked again at the subdivisions of this downwards movement, and I come to the conclusion that if downwards movement is a correction it can only be a rare triple zigzag. The subdivisions all fit perfectly.
However, a triple zigzag and a diagonal (particularly an ending diagonal) have exactly the same subdivisions–all subwaves are zigzags. This downwards structure may be a leading diagonal of a new impulse downwards, which fits for our alternate daily wave count.
Downwards movement is very choppy and overlapping, typical of a corrective B wave.
Movement above 1,195.86 would confirm this main wave count as at that stage the alternate would be invalidated.
If wave c orange extends the zigzag of wave (z) green any lower it may not move beyond the start of wave a pink below 1,114.22.
If downwards movement breaches 1,114.22 then the alternate below would be confirmed.
Alternate Hourly Wave Count.
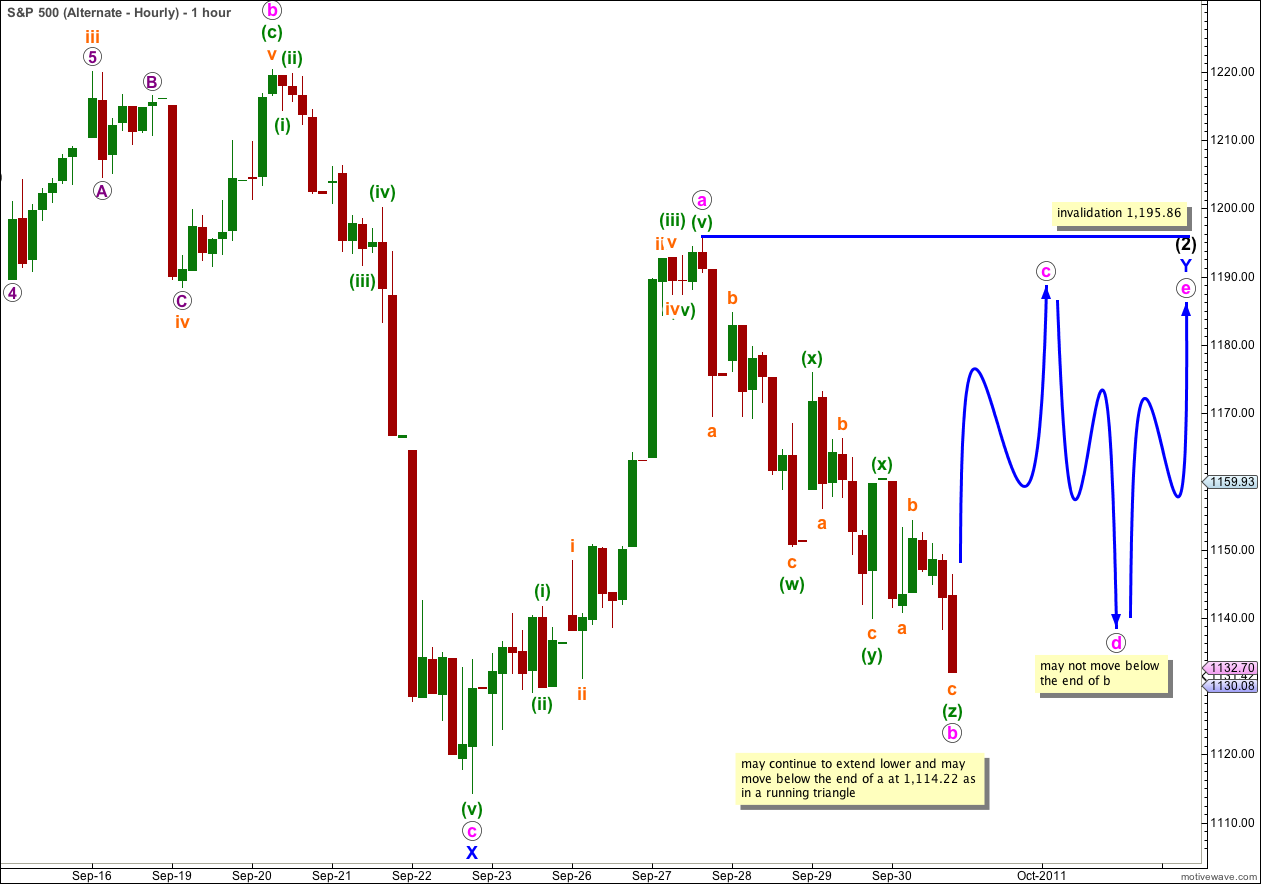
It is possible that wave (2) black is unfolding as a double combination with wave Y blue as a triangle. The most common type of triangle is a contracting triangle, and if wave b pink is complete here then this would be the case.
However, wave b pink of a running triangle (contracting, expanding or barrier) may move beyond the start of wave a pink, and if wave Y blue is a running triangle wave c orange within the third zigzag of wave b pink may continue to extend lower below 1,114.22.
Thereafter, wave c pink may not move beyond the end of wave a pink for a contracting or barrier triangle. These structures would be invalidated with movement above 1,195.86.
Thereafter, wave d pink may not move beyond the end of wave b pink for a contracting triangle. For a barrier triangle wave b may end at essentially the same level of wave b pink creating a flat B-D trend line, which means that d can move ever so slightly below b but not by much at all.
Thereafter, wave e may not move beyond the end of c.
If wave Y blue is to be a triangle then we should know within another one to two trading days.
Only if price remains below 1,195.86 and the choppy overlapping movement continues essentially sideways for another two days would we seriously consider a triangle here. At this stage the probability is fairly low.
Alternate Daily Wave Count.
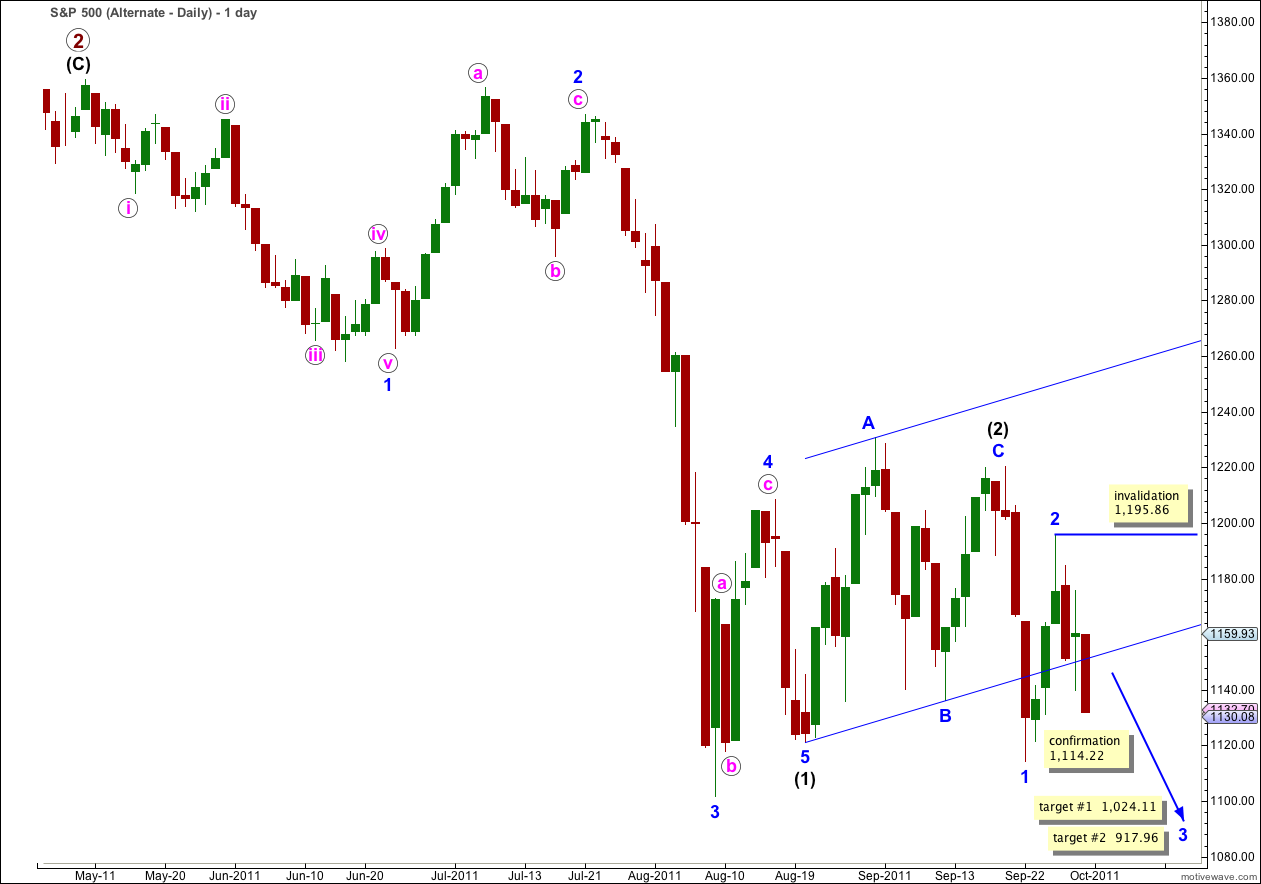
This alternate wave count sees wave (2) black as over and wave (3) black as underway.
Within wave (3) black waves 1 and 2 blue are complete and wave 3 blue is underway.
This wave count sees the S&P 500 as within wave 3 blue of wave (3) black of primary wave 3. If this is the case we would expect very strong downwards momentum and this is clearly not the case. Recent wave behaviour does not support this wave count at all.
Furthermore, we would have to see the movement from the low labeled 1 blue to the high labeled 2 blue as a three wave structure. This is possible, but this movement is very difficult to analyse as it is most easily seen as a five, and it has the overall look of a five and not a three.
Recent downwards movement, which is counted as a triple zigzag for the main wave count, would here be seen as a leading diagonal for wave i pink within wave 3 blue. Following a leading diagonal in a first wave position, we should expect a deep second wave correction followed by a strong extended third wave.
Only if price moves below 1,114.22 should we seriously consider this wave count.
Movement above 1,195.86 would invalidate this wave count as within wave 3 blue no second wave correction may move beyond the start of its first wave.