
Elliott Wave chart analysis for the S&P 500 for 29th September, 2011. Please click on the charts below to enlarge.
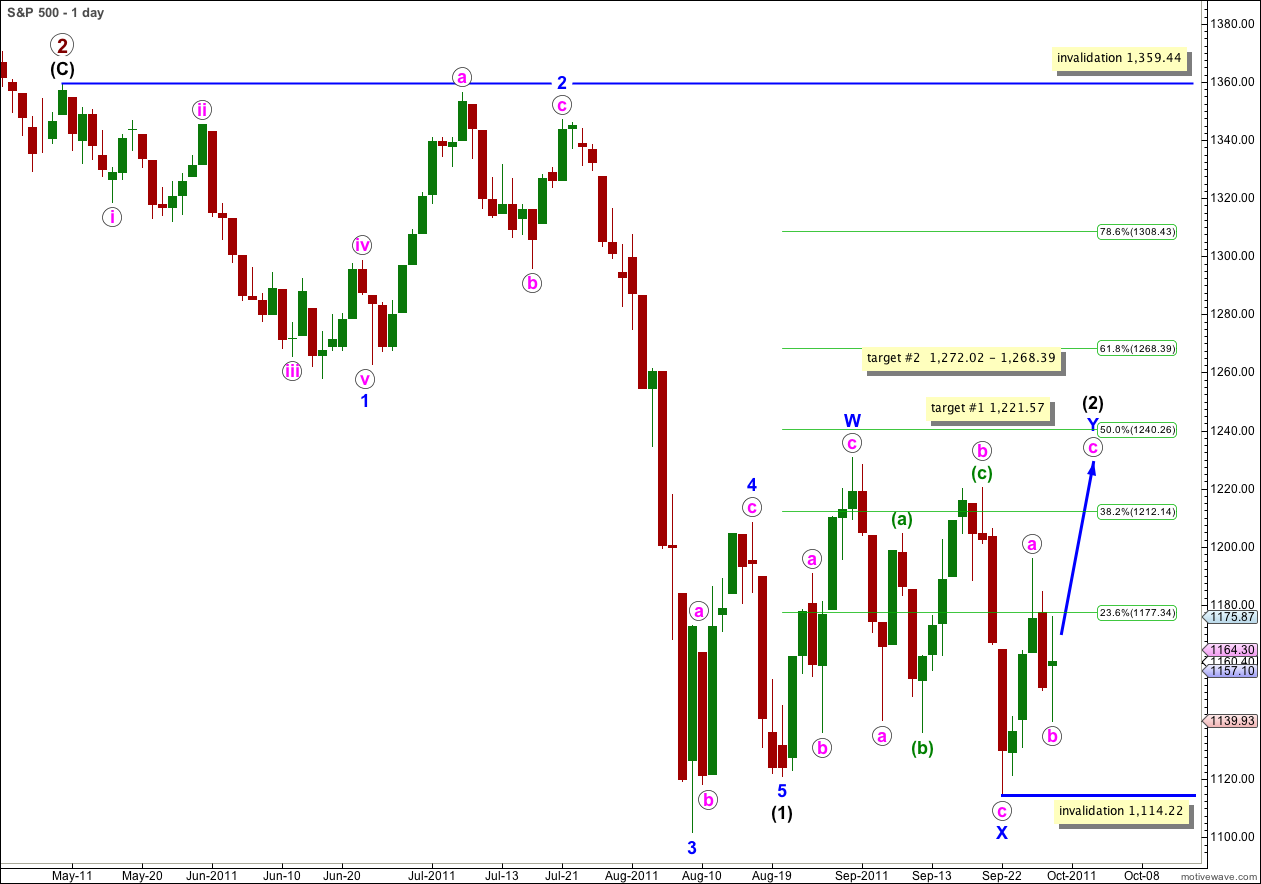
The S&P 500 has moved lower below 1,141.72 which invalidated one interpretation of wave (2) black as a zigzag, indicating that wave (2) black is a double zigzag.
At this stage wave Y blue, the second structure within the double, is unfolding. It requires further upwards movement before it is complete. It may last another 2 days, to end during Monday’s session next week, if it is to last a Fibonacci 8 days and be equal in duration with wave W blue.
Wave Y blue is a zigzag because wave a pink within it is a five wave structure. Within a zigzag wave b may not move beyond the start of a. This wave count is invalidated with movement below 1,114.22.
Normally the purpose of a double zigzag is to deepen a correction. It is fairly likely then that wave Y blue will make a new high above the high labeled W blue at 1,230.71.
Within wave Y blue wave b pink may be complete as a double zigzag, or it may continue a little lower as a triple. Triple zigzags are rarer than double zigzags, and the alternate hourly wave count has a lower probability.
Main Hourly Wave Count.
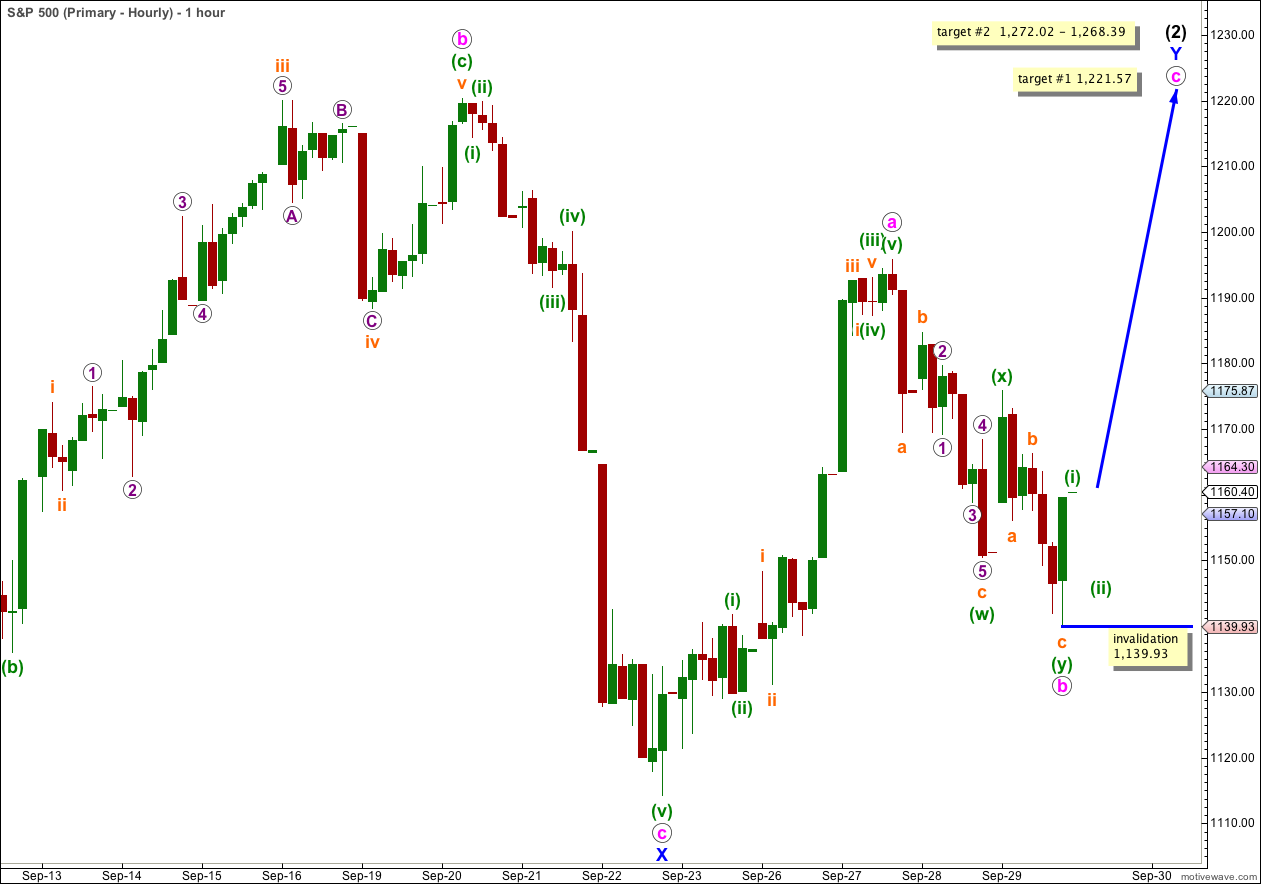
Wave Y blue is most likely a zigzag because wave a pink is seen most easily as a five wave structure. This labeling within a pink was determined after careful examination of the 5 minute chart.
One thing which is clear from the look of this chart is that recent downwards movement is choppy and overlapping, as it looks typically corrective and not impulsive. Wave behaviour supports this wave count.
Wave b pink extended lower and has remained above the invalidation point. It subdivides most easily into a double zigzag.
Within wave (w) green there is no Fibonacci ratio between waves a and c orange.
Within wave (y) green there is no Fibonacci ratio between waves a and c orange.
Wave c orange within wave (y) green is almost exactly equal in length to wave a orange within wave (w) green.
Upwards movement which ended Thursday’s session is unfolding as a perfect impulse on the 5 minute chart. This may be wave (i) green within wave c pink.
Within wave c pink wave (ii) green may not move beyond the start of wave (i) green. This wave count is invalidated with movement below 1,139.93.
If this wave count is invalidated by downwards movement then we shall use the alternate below.
Alternate Hourly Wave Count.
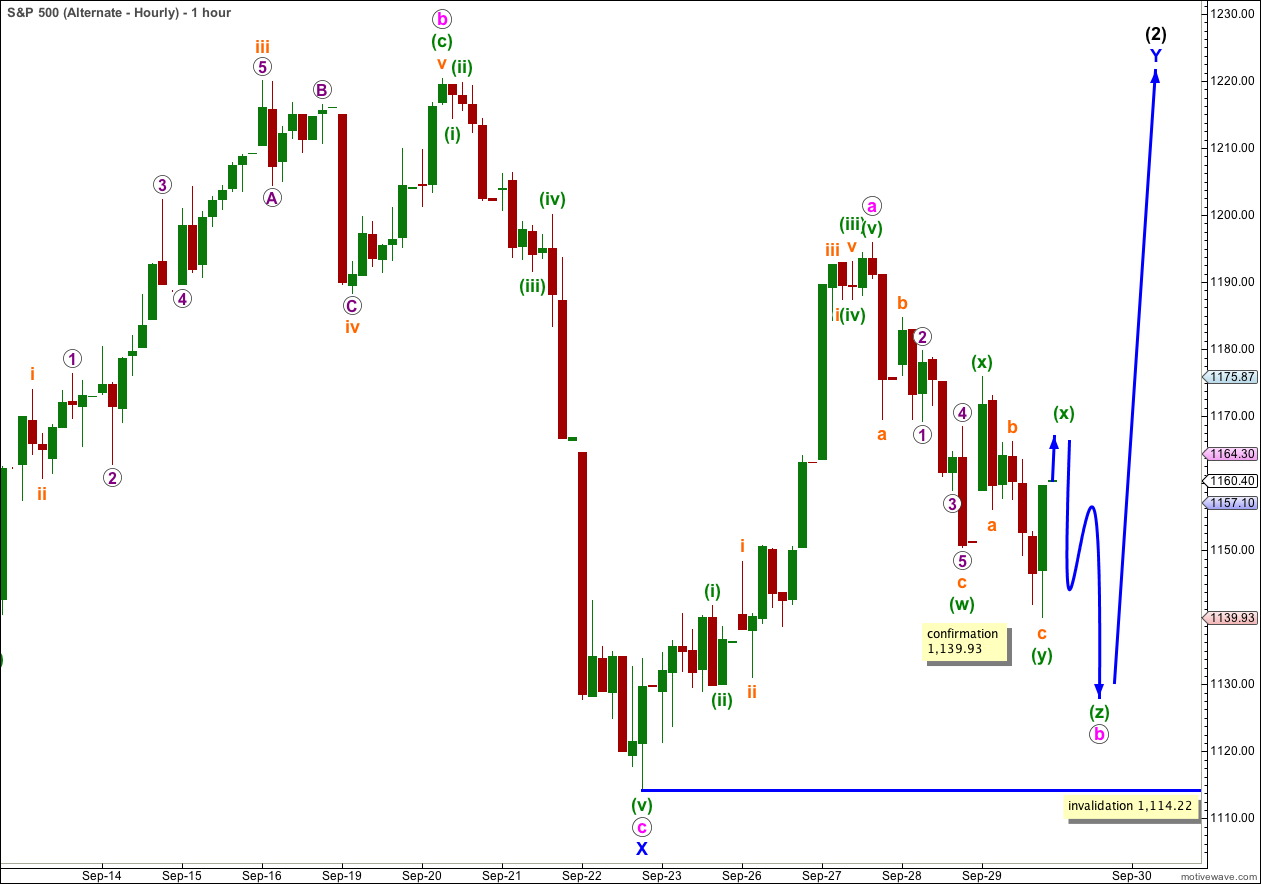
It is possible that wave b pink is incomplete as it may continue lower as a triple zigzag.
The probability of this alternate wave count is lower than the main hourly wave count.
Movement below 1,139.93 would confirm this wave count and invalidate the main hourly wave count.
Wave b pink may not move beyond the start of wave a pink. This wave count is invalidated with movement below 1,114.22.
Daily Alternate Wave Count.
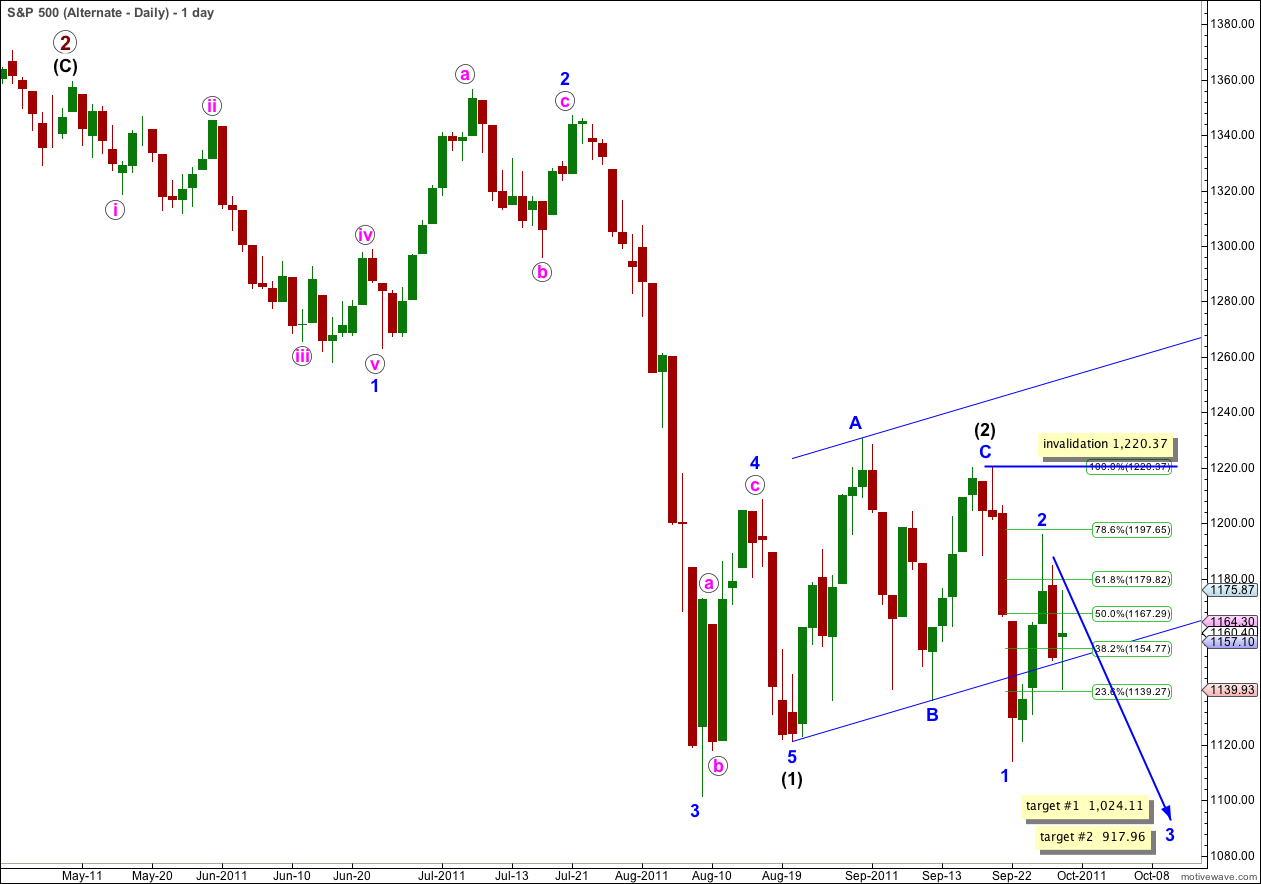
Only if the main daily wave count is invalidated with very strong downwards movement below 1,114.22 should we consider this alternate.
The subdivisions within recent movement do not fit as well, and wave behaviour is not supporting this wave count.
But, I have learned the hard way to never completely discount an alternate, as sometimes subsequent price action shows that it is correct.
If wave 3 blue is beginning as a leading diagonal then we may be seeing a series of lower trending zigzags, followed by a deep second wave correction, and an explosive extended third wave down after that.
At this stage this alternate has a very low probability.