
Elliott Wave chart analysis for the S&P 500 for 28th September, 2011. Please click on the charts below to enlarge.
As of yesterday this was our main daily wave count (with one small change), and as of today it will be our only daily wave count.
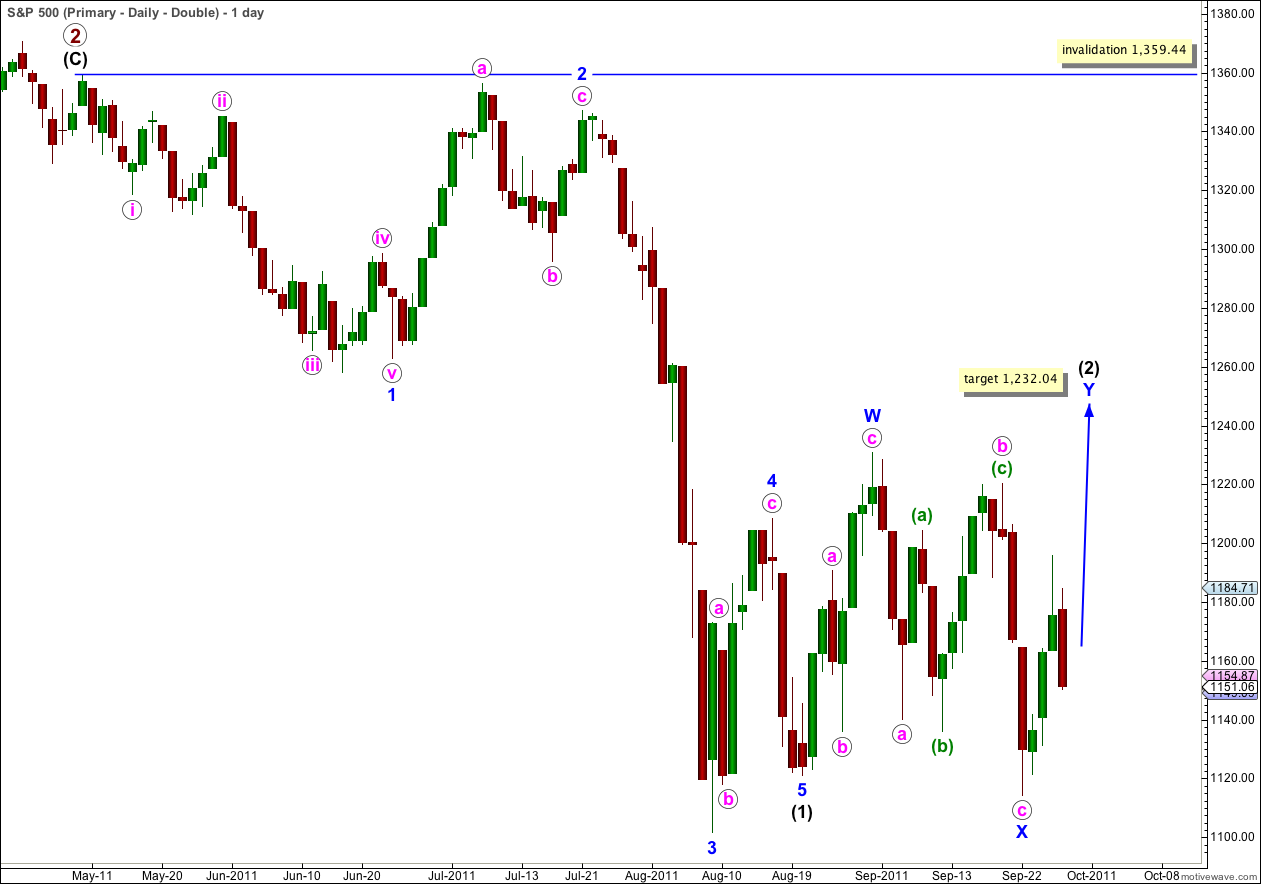
This structure for wave (2) black may be unfolding as either a double or a flat correction.
The wave count above outlines wave (2) black as a double, and if we replace blue W-X-Y with blue A-B-C it is a flat correction.
If it is a double correction then the second structure has begun with a five waves up, and the second structure is likely to be a zigzag. It may also be a triangle as one of the subwaves of a triangle does not have to be a zigzag. However, this is highly unlikely.
Wednesday’s session saw downwards movement which subdivided into a three. Unless it continues further down when markets open tomorrow then we know that at this stage (for the short term anyway) the trend is upwards, as we have five up and three down. This means we have to expect another five up to complete a full structure.
I will not present yesterday’s alternate wave count again because it is now looking very unlikely.
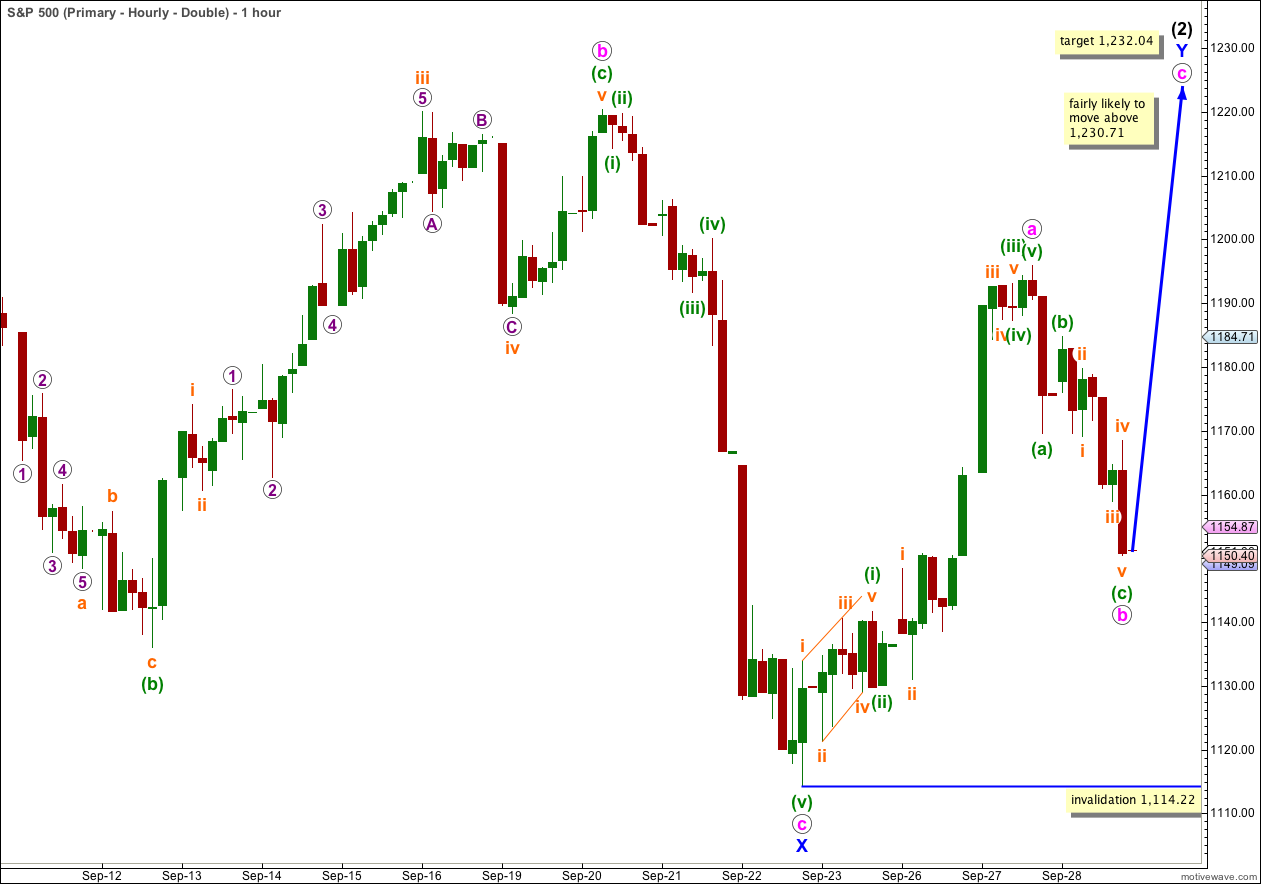
With yesterday’s strong downwards movement following a five up it looks like another zigzag is unfolding. Wave b pink is a 56% correction of wave a pink, and it subdivides into a perfect zigzag.
Within wave b pink there is no Fibonacci ratio between waves (a) and (c) green, and within wave (c) green there are no Fibonacci ratios between waves i, iii and v orange.
I have adjusted the wave count for upwards movement labeled a pink again, after another analysis of the 5 minute chart. Wave (iii) green subdivides into a perfect impulse, as does wave iii orange within it.
If wave Y blue is a zigzag then wave b pink may not move beyond the start of wave a pink. This wave count is invalidated with movement below 1,114.22.
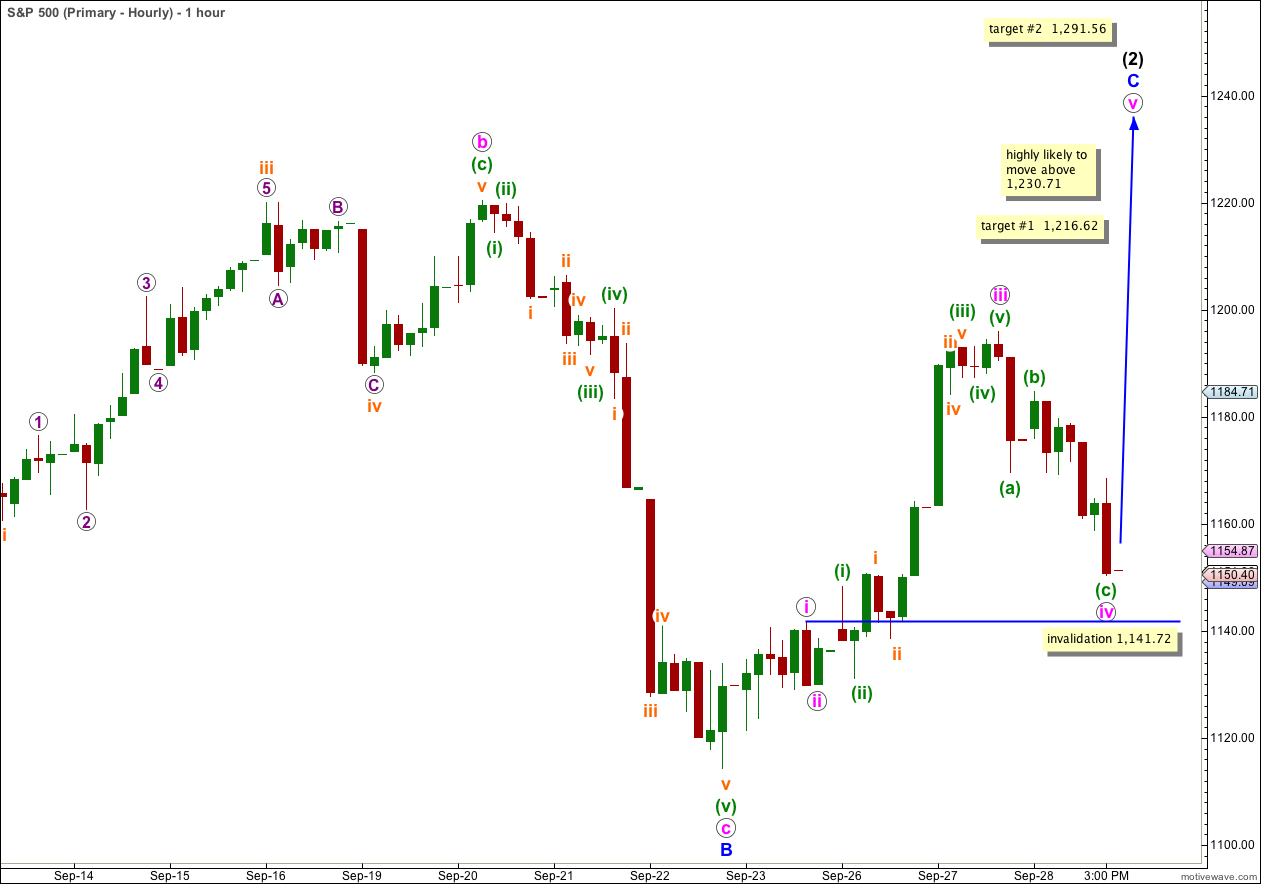
Alternately, if wave (2) black is a zigzag then downwards movement is a fourth wave within wave C blue.
The analysis of subdivisions of the end of wave iii pink is less satisfactory here than for the first hourly wave count.
If this wave count is correct then it is very likely that wave C blue would make a new high above the end of wave A blue at 1,230.71.
The first target at 1,216.62 is where wave v pink within wave C blue would reach equality with wave iii pink.
The second, more likely target, is at 1,291.56 where wave C blue would reach 1.618 the length of wave A blue.
Wave iv pink may not move into wave i pink price territory. This wave count is invalidated with movement below 1,141.72.