
Elliott Wave chart analysis for the S&P 500 for 27th September, 2011. Please click on the charts below to enlarge.
Again, upwards movement was not what yesterday’s main wave count expected, which is now an alternate count and looks quite unlikely. I have found an alternate which has the right look and fit, and I’ve swapped the wave counts over: what was yesterday’s main wave count is now an alternate, and today’s main wave count is a new wave count.
Main Wave Count.
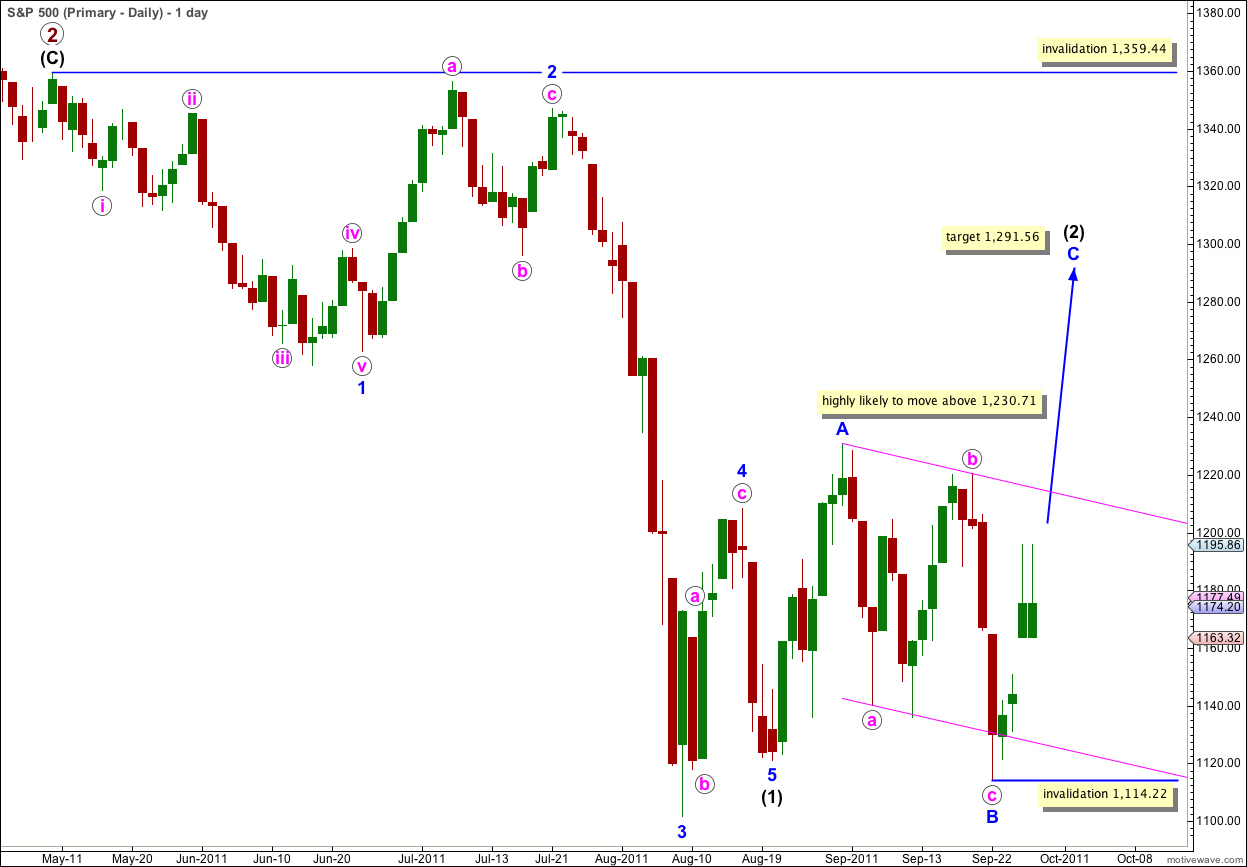
This wave count sees wave (2) black as incomplete.
All subdivisions fit perfectly and there are excellent Fibonacci ratios within this count. It explains the upwards movement of the last 4 days very well indeed. Proportions are good and it has the right look.
Wave (2) black is incomplete and is unfolding as an expanded flat correction. Wave B blue within it was a 106% correction of wave A blue, which is just above the minimum requirement of 105% for an expanded flat.
At 1,291.56 wave C blue would reach 1.618 the length of wave A blue and this expanded flat would have a typical look.
A parallel channel cannot be drawn around an expanded flat. We must use a parallel channel about wave C blue to determine where it may end, and when it may be over.
I would expect wave C blue to at least reach above the downwards sloping parallel channel here containing wave B blue.
Wave C blue would be highly likely to take price above the end of wave A blue at 1,230.71 to avoid a truncation.
Wave (2) black may not move beyond the start of wave (1) black. This wave count is invalidated with movement above 1,359.44.
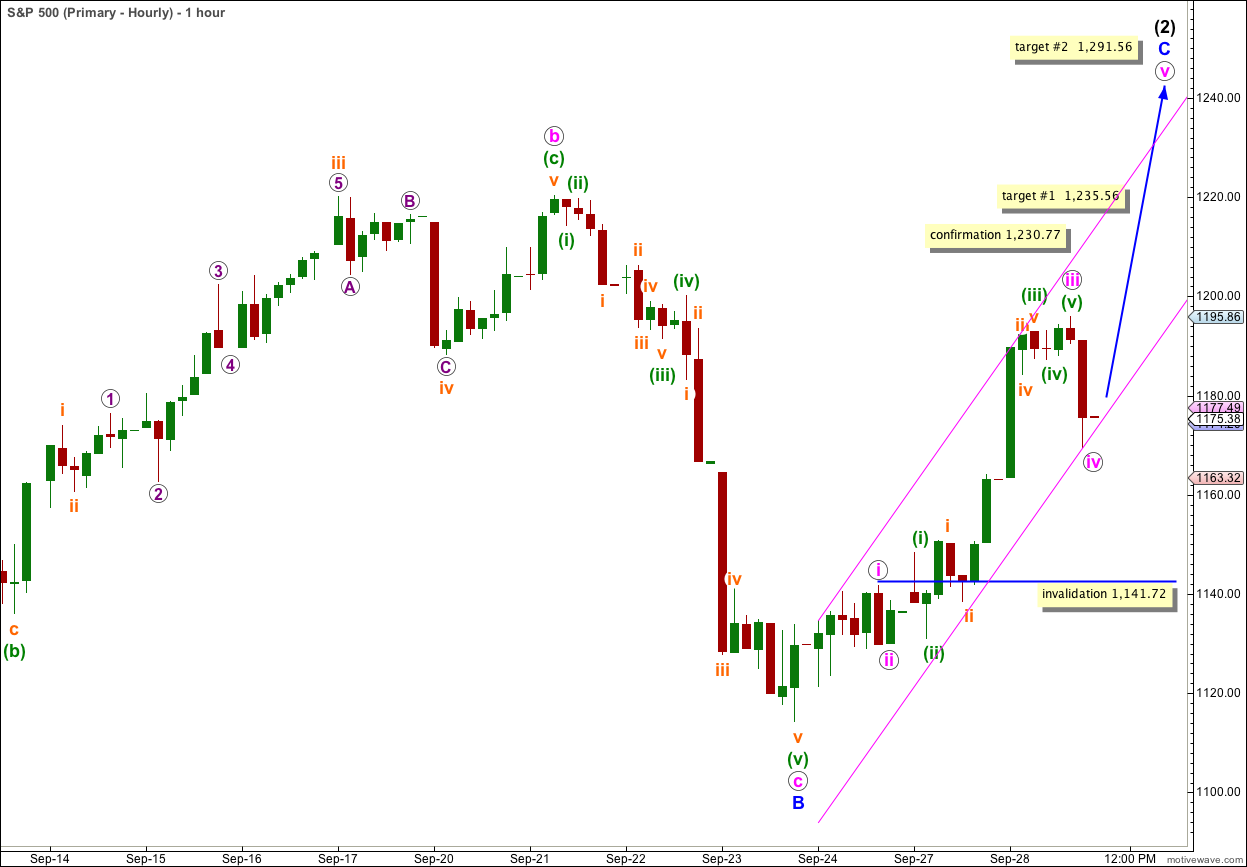
This wave count is now more satisfactory in its subdivisions for the end of downwards movement labeled v orange to end B blue, than our alternate wave count.
Wave C blue is unfolding as an impulse. Wave iii pink within it is 5.98 points short of 2.618 the length of wave i pink. At 1,235.66 wave v pink would reach equality with wave iii pink and this is our first target for upwards movement to end.
However, this first target would see wave C blue truncated, reducing its probability. The second higher target is more likely.
Ratios within wave iii pink are: wave (iii) green has no Fibonacci ratio to wave (i) green, and wave (v) green is just 0.48 points short of 0.146 the length of wave (iii) green.
Ratios within wave (iii) green are: wave iii orange is 2.55 points longer than 2.618 the length of wave i orange, and wave v orange is 0.71 points longer than 0.146 the length of wave iii orange.
Using Elliott’s channeling technique about this C wave does not create a satisfactory parallel channel so I’ve created a “best fit” channel. Wave v pink may end either midway or about the upper edge of this parallel channel.
When we can see significant movement below the channel then we know wave 2 blue is complete and wave 3 blue down is underway.
Any further downwards extension of wave iv pink may not move into wave i pink price territory. This wave count is invalidated with movement below 1,141.72.
Movement above 1,230.77 would confirm this wave count as at that stage our alternate would be invalidated.
Alternate Wave Count.
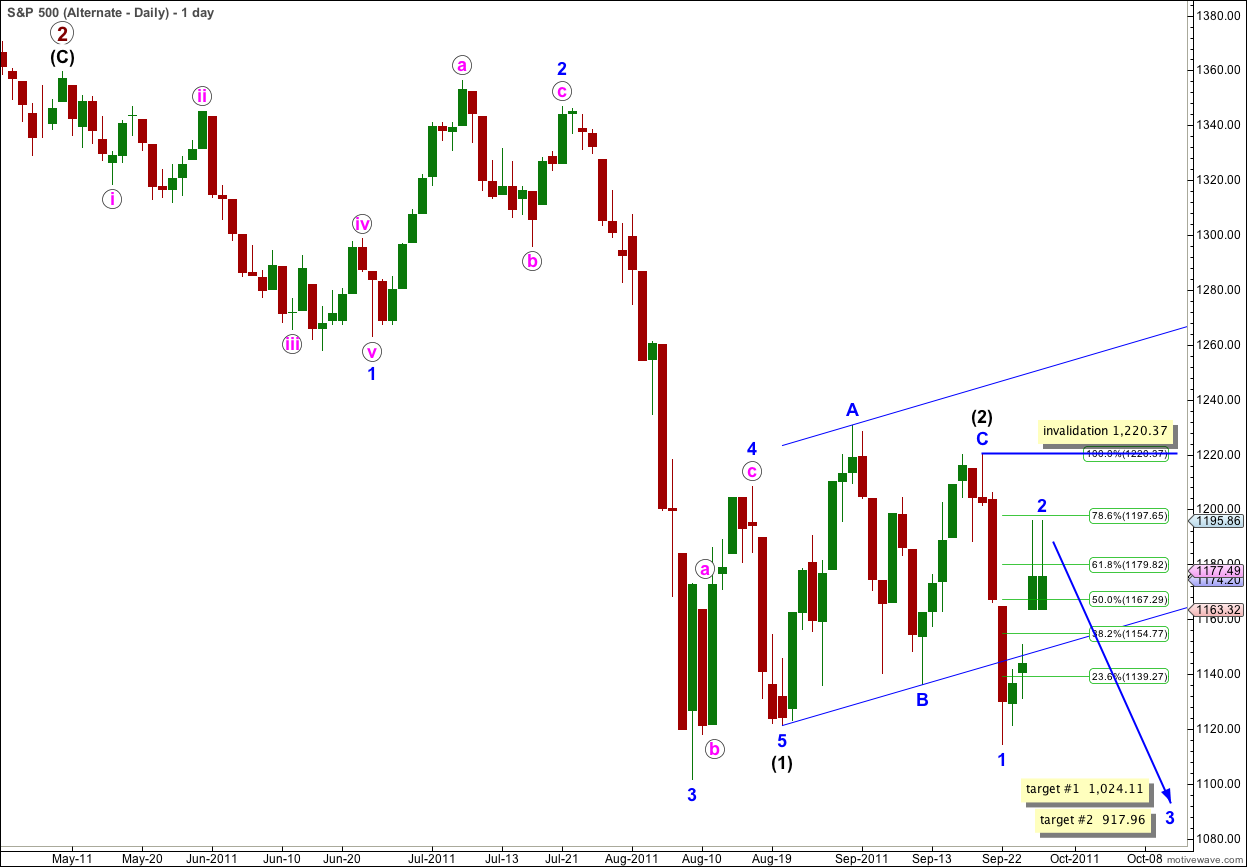
This was yesterday’s main wave count. Further significant upwards movement has made it look very unlikely. If wave (3) black has begun we would expect corrections to be relatively brief and shallow. However, it remains valid because wave 2 blue may move to the start of wave 1 blue but not beyond. Movement above 1,220.37 would invalidate this wave count.
If wave 3 blue has begun at 1,195.86 then we may calculate targets for it to end. Further upwards movement would mean these targets have to be recalculated.
At 1,024.11 wave 3 blue would reach 1.618 the length of wave 1 blue.
At 917.96 wave 3 blue would reach 2.618 the length of wave 1 blue.
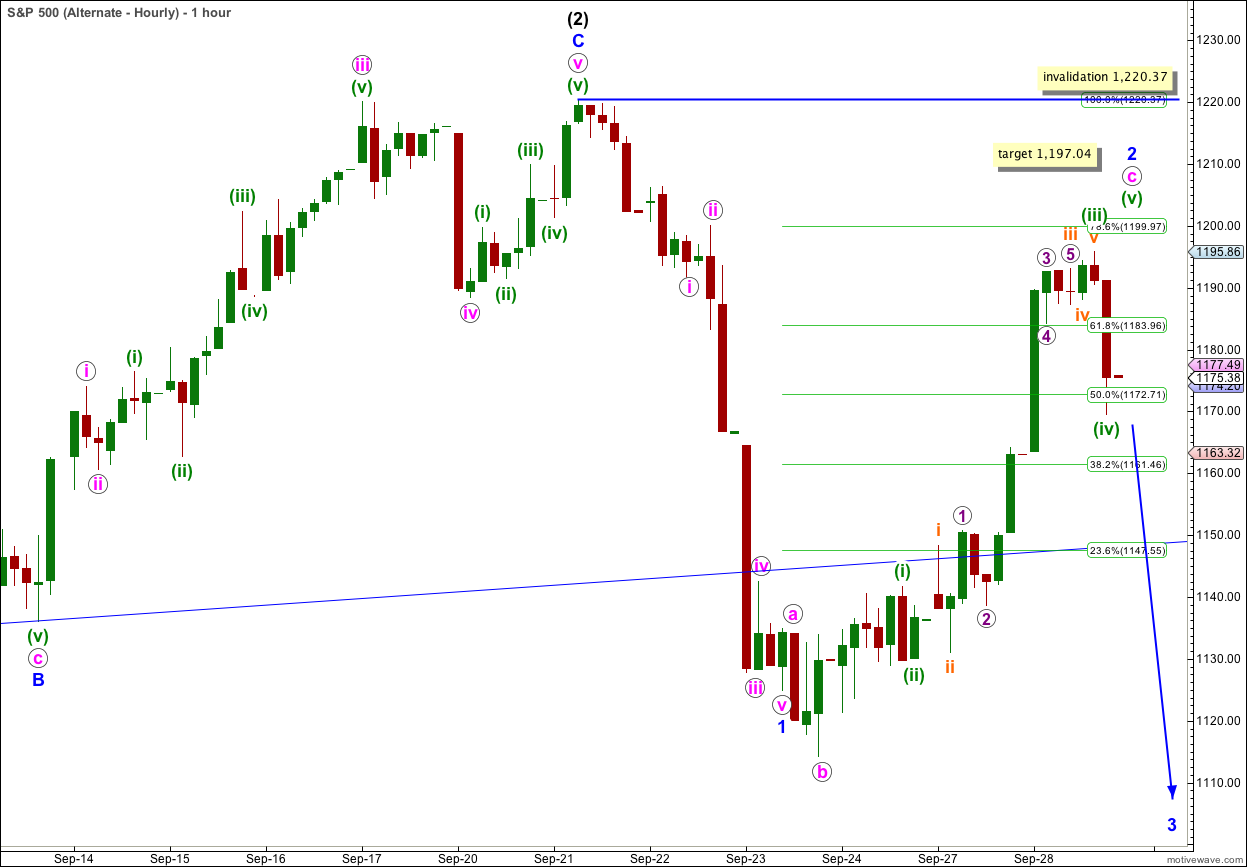
Wave 2 blue here is seen as an expanded flat correction. Although the subdivisions still fit, it now has a very strange look. Wave c pink is too long as it has passed 2.618 and even 4.236 the length of wave a pink. This reduces the probability that this wave count is correct.
We would not expect within wave (3) black to have a 0.786 correction for wave 2 blue; although this is possible it is unlikely.
Wave 2 blue may not move beyond the start of wave 1 blue. This wave count is finally technically invalidated with movement above 1,220.37.