
Elliott Wave chart analysis for the S&P 500 for 26th September, 2011. Please click on the charts below to enlarge.
Movement above 1,141.72 invalidated the labeling on the last hourly wave count as this second wave correction may have extended higher.
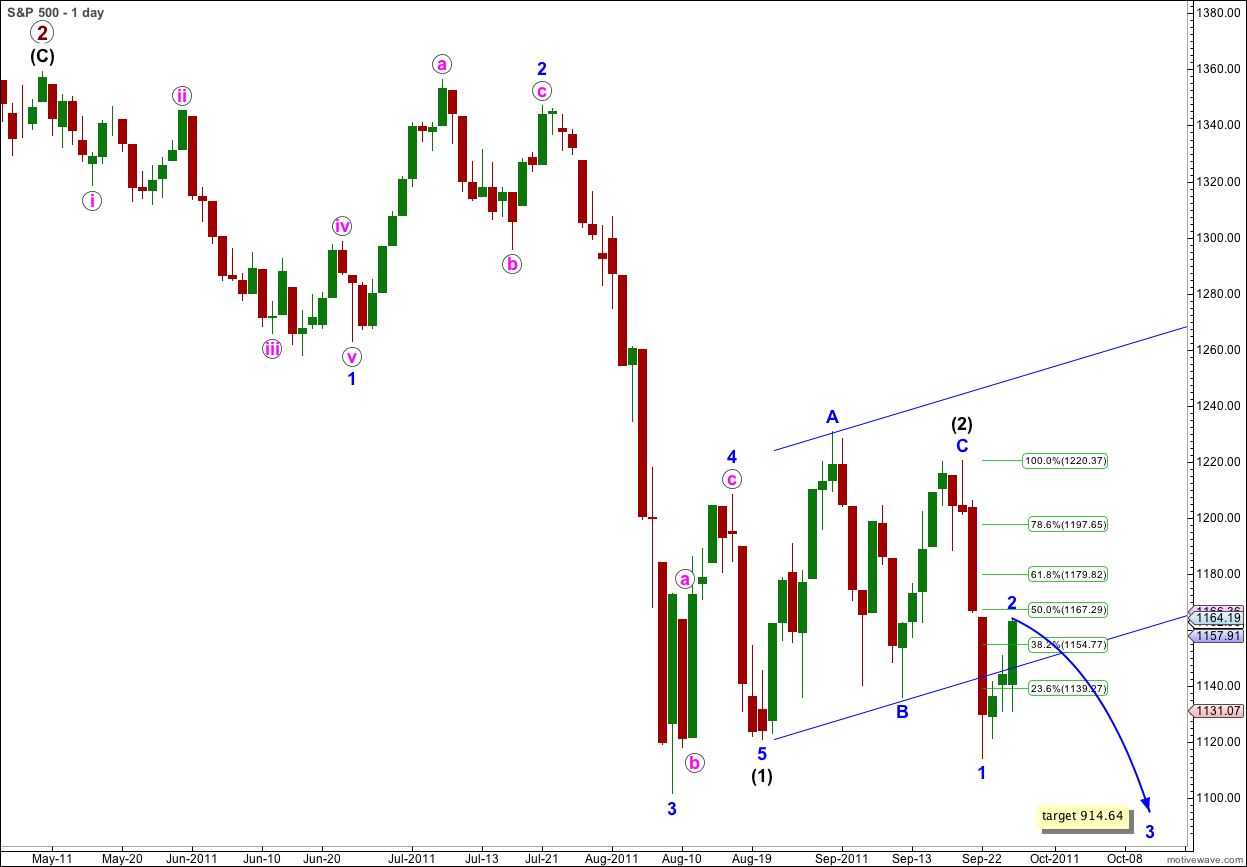
The lower edge of the parallel channel containing wave (2) black did not provide too much resistance to upwards movement as this was overcome fairly quickly.
I have increased the degree of labeling for recent downwards movement by one degree. We may just have seen waves 1 and 2 blue within wave (3) black complete. At 914.64 wave 3 blue would reach 2.618 the length of wave 1 blue.
This target for wave 3 blue fits in nicely with our target for wave (3) black. At 834.72 wave (3) black would reach 1.618 the length of wave (1) black.
Wave 2 blue is now a complete structure and it should be over here. It has remained below the 50% level of wave 1 blue and would still correctly be termed a shallow correction.
The unexpected upwards movement of Monday, particularly with price moving back into the parallel channel containing wave (2) black, places some doubt on this wave count. I think that until shown otherwise now we may have to consider the alternate a little more seriously. This main wave count is still the more likely of the two.
The subdivisions of this wave count all fit perfectly. For this reason I prefer this main wave count still, despite the strong upwards movement during Monday’s session.
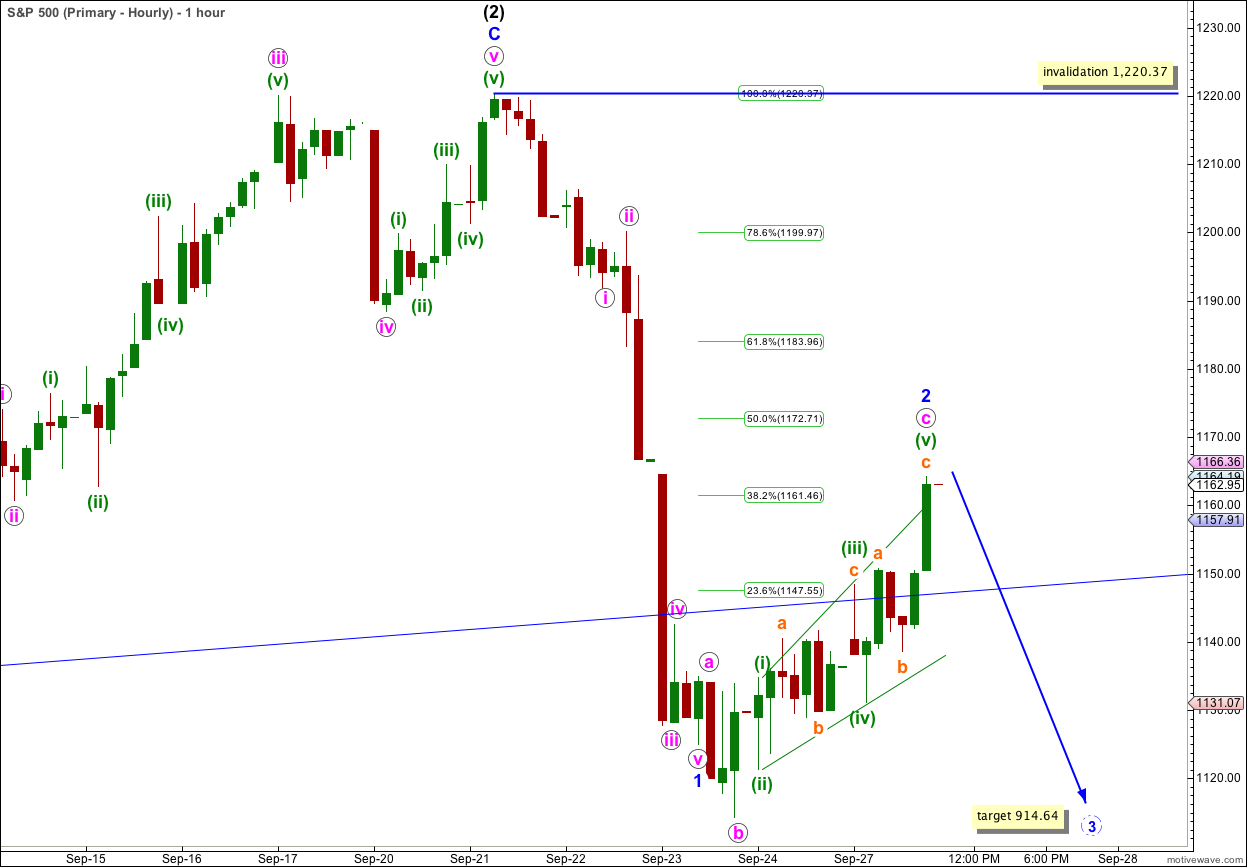
Wave a pink subdivides into a three, as does wave b pink. Wave c pink subdivides perfectly into an ending expanding diagonal.
Ratios within wave 1 blue are: wave iii pink is just 0.34 short of 2.618 the length of wave i pink, and wave v pink is just 0.34 longer than 0.618 the length of wave i pink.
If this wave count is correct then I would expect wave 3 blue to start tomorrow. Any further upwards movement will reduce the probability of this wave count some more.
Alternate Wave Count.
We have considered this wave count before. It has a low probability because the subdivisions do not have a very good fit.
However, it could explain yesterday’s upwards movement being deeper and stronger than we expected.
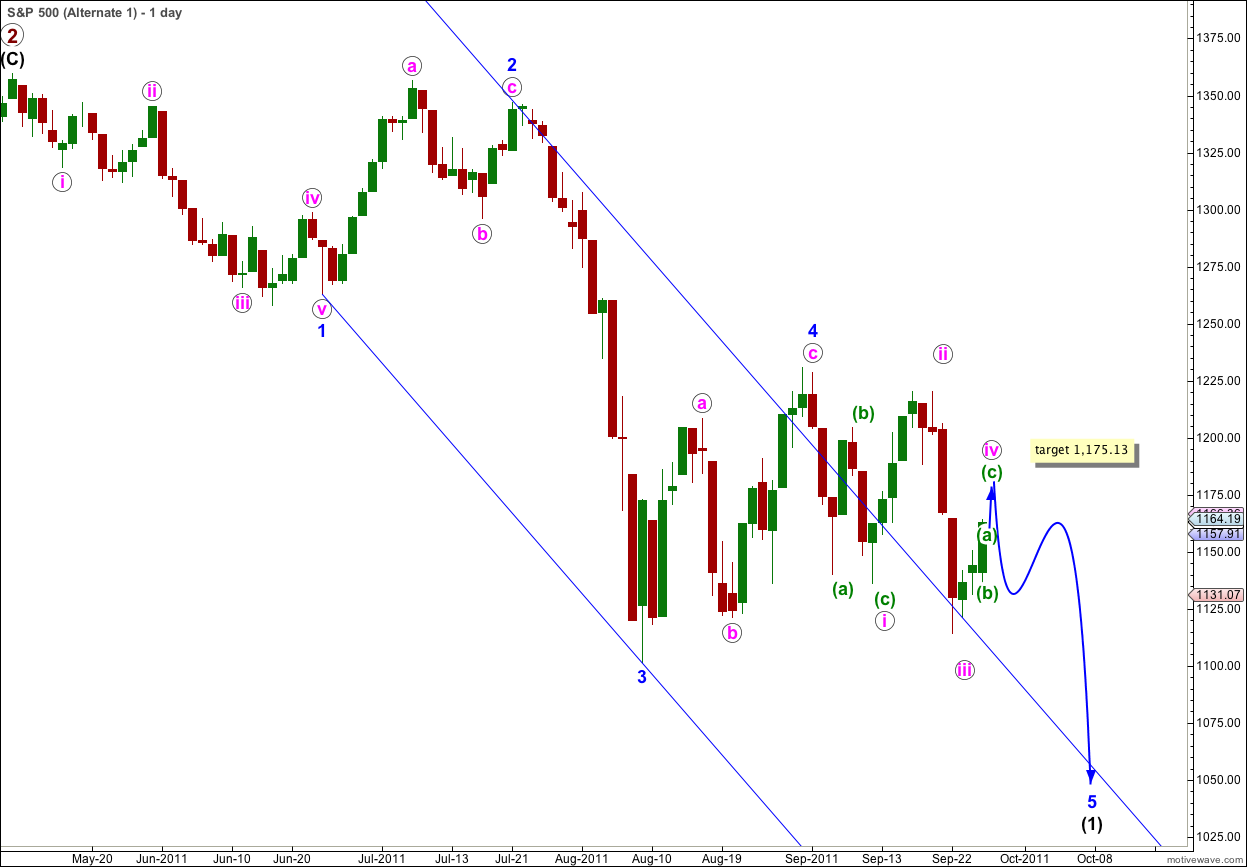
Wave 5 blue would be unfolding as an ending diagonal. The diagonal should be expanding because wave iii pink was longer than wave i pink. However, I have often seen diagonals where the third wave is still the longest.
An ending diagonal must have all subwaves as zigzags.
Wave iv of a diagonal should overlap wave i price territory, but it may not move beyond the end of wave ii. This wave count is invalidated with movement above 1,220.37.
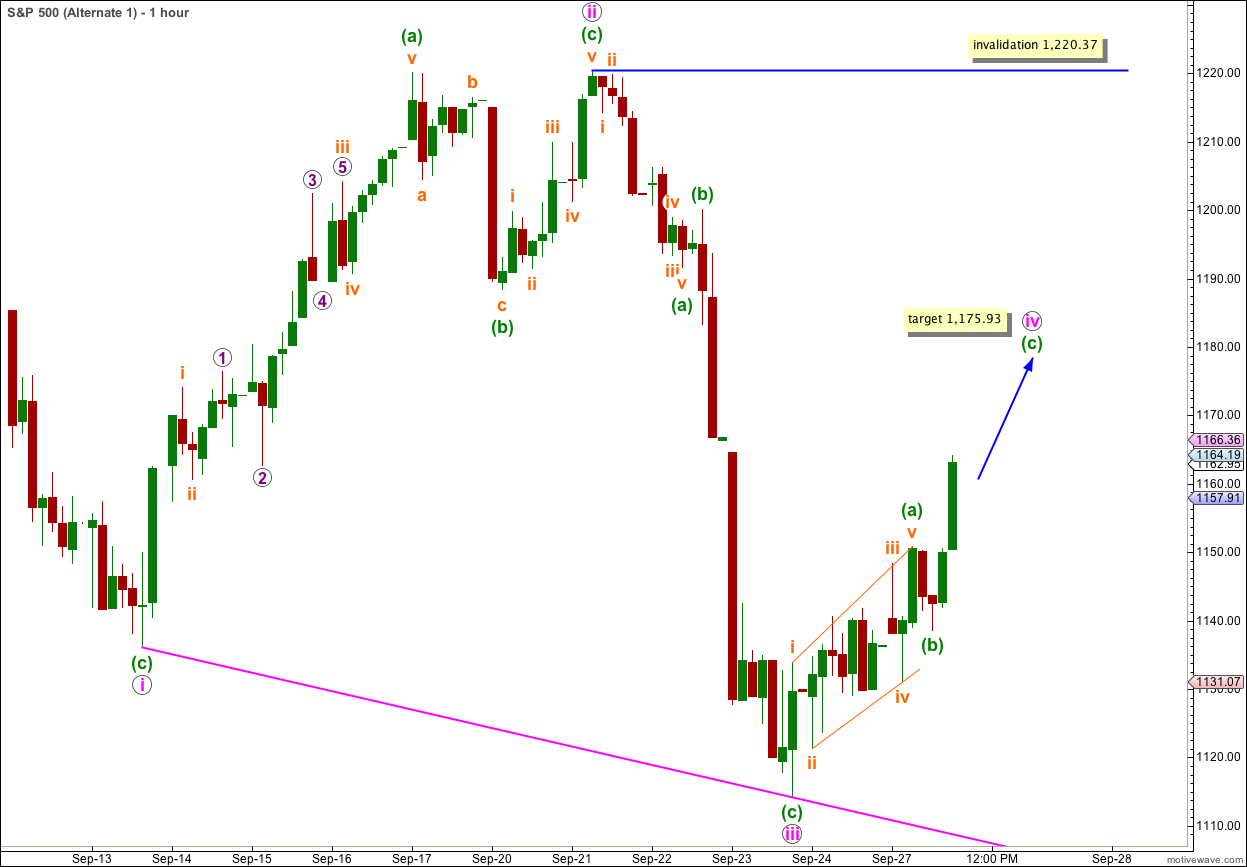
The target for wave iv pink zigzag to end is at 1,175.93 where wave (c) green would reach equality with wave (a) green.
The subdivisions almost work for this piece of movement, but I have some small reservations about wave (c) green as this does not have the right look.
Unfortunately, this wave count has the same invalidation point as the main wave count. We cannot at this stage have a point of differentiation between the two.
This alternate wave count expects a little further upwards movement to complete wave iv pink before wave v pink down begins.
At that stage both our wave counts expect further downwards movement. This alternate expects a zigzag down with a lack of momentum, while the main wave count expects very strong downwards movement.