
Elliott Wave chart analysis for the S&P 500 for 21st September, 2011. Please click on the charts below to enlarge.
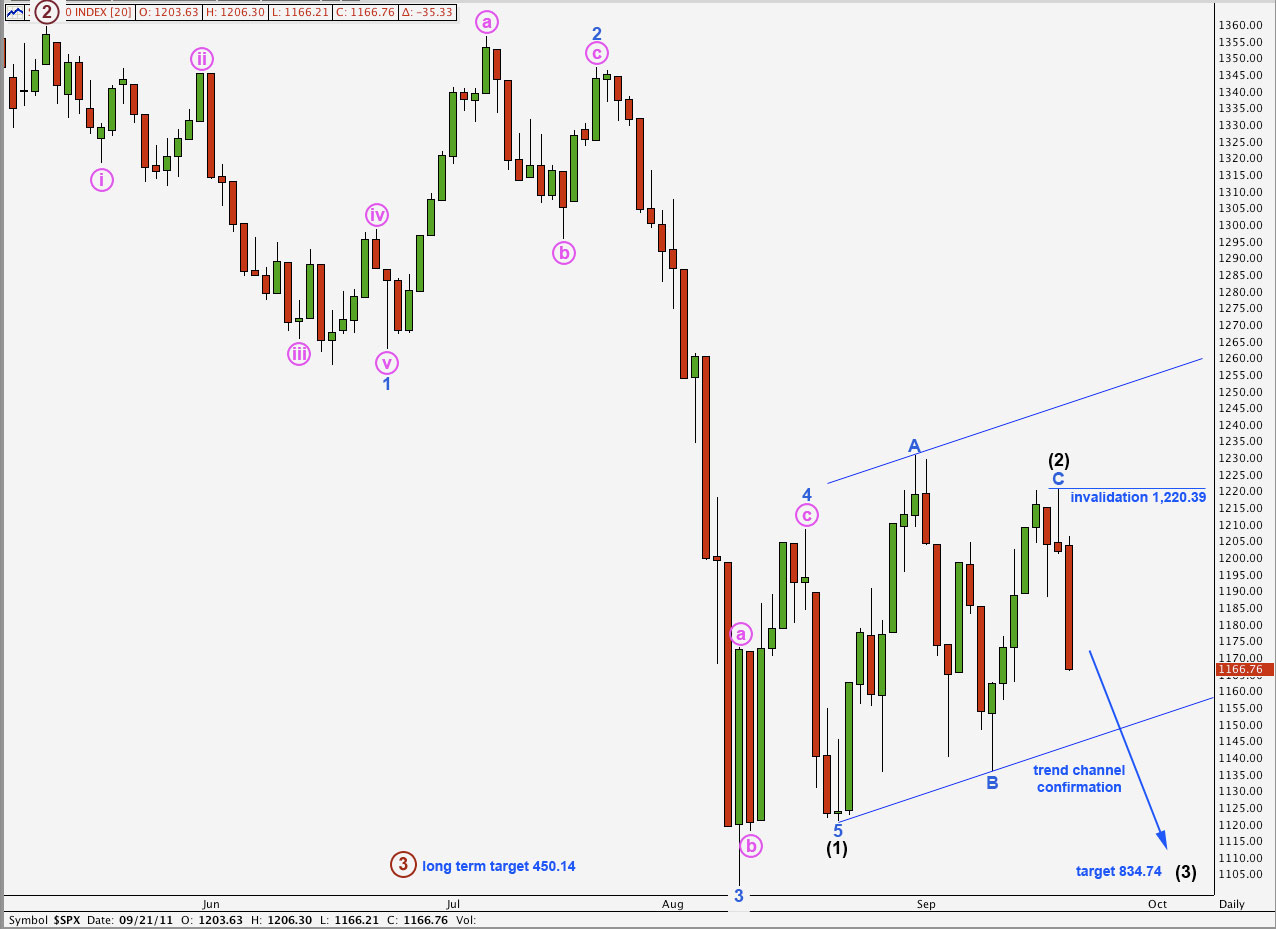
Movement below 1,188.36 has provided some clarity: wave (2) black is most likely to be over one day earlier than we expected, and with a truncated C wave. Downwards movement may be wave (3) black, in its very early stages.
At this critical juncture I have taken another close look at the possibility that this downwards movement is only wave 5 blue of wave (1) black. I have 5 minute charts of the critical piece of movement below, which differentiates this alternate idea from our main wave count. The main wave count fits the subdivisions much better and it looks most likely that this downwards movement would be the third wave.
However, we have two hourly wave counts today. One wave count looks at the possibility that wave (2) black may still be unfolding as a double zigzag and wave b pink within the second zigzag may have taken price lower. This alternate possibility would be invalidated with movement below 1,136.07.
If price continues lower tomorrow, particularly if it moves below 1,136.07, then the probability that this is a third wave within a third wave will be very high.
Within wave (3) black no second wave correction may move beyond the start of the first wave. This wave count is invalidated with movement above 1,220.39.
Main Hourly Wave Count.
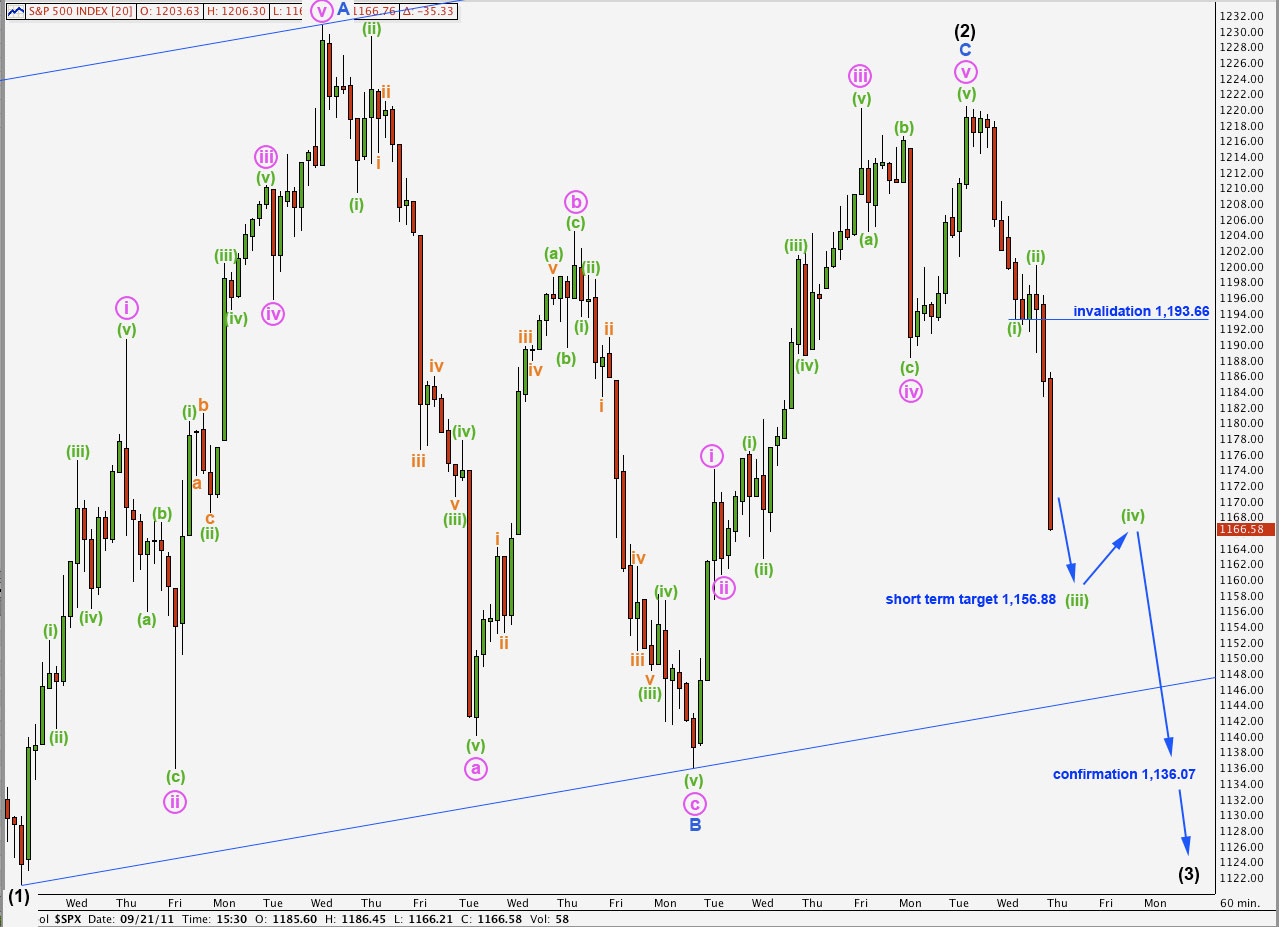
This was our alternate yesterday.
Wave (2) black is here labeled as a zigzag with a truncated C wave.
The subdivisions for this wave count all fit very well indeed.
A short term target for wave (iii) green to end tomorrow is at 1,156.88. About this point we may see a small fourth wave bounce.
Wave (iv) green may not move into wave (i) green price territory. This wave count is invalidated with movement above 1,193.66.
If this wave count is correct then the implications are important. We should see an increase in downwards momentum which will quickly make new lows. Corrections should be brief and shallow. This wave count anticipates a market crash has just begun, and it will pick up speed.
Movement below 1,136.07 would confirm a trend change. Along with strong momentum continuing downwards this would confirm a third wave.
Alternate Hourly Wave Count.
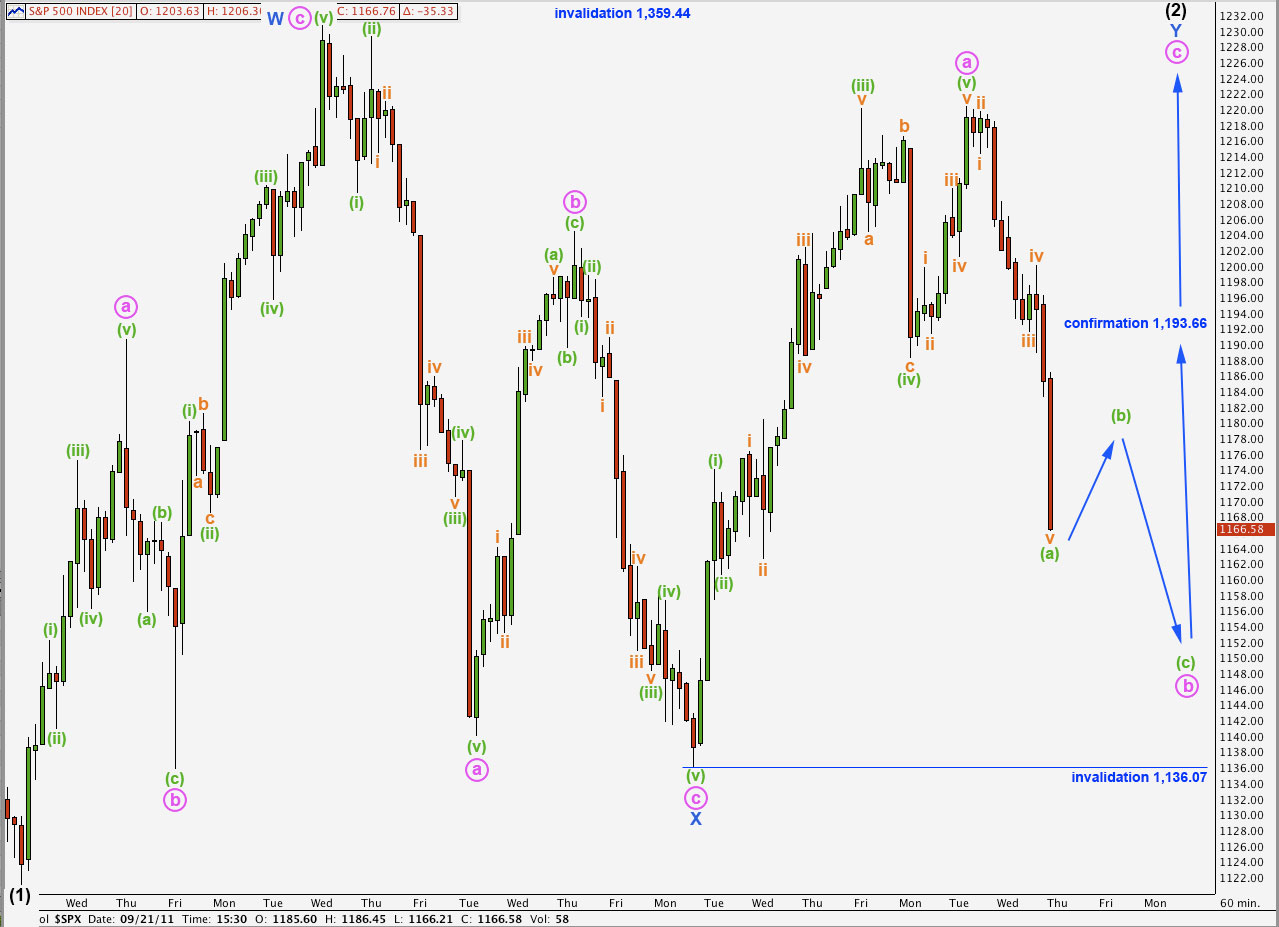
Alternately, it is possible that wave (2) black is incomplete as a double zigzag. Wave Y blue, the second zigzag in the double, would be most likely to end above 1,230.71, making a new high above W blue.
The subdivisions are not as satisfactory for this alternate wave count, although the overall look is a bit better within (2) black.
Wave b pink may not move beyond the start of wave a pink. This wave count is invalidated with movement below 1,136.07.
Alternate Daily Wave Count.
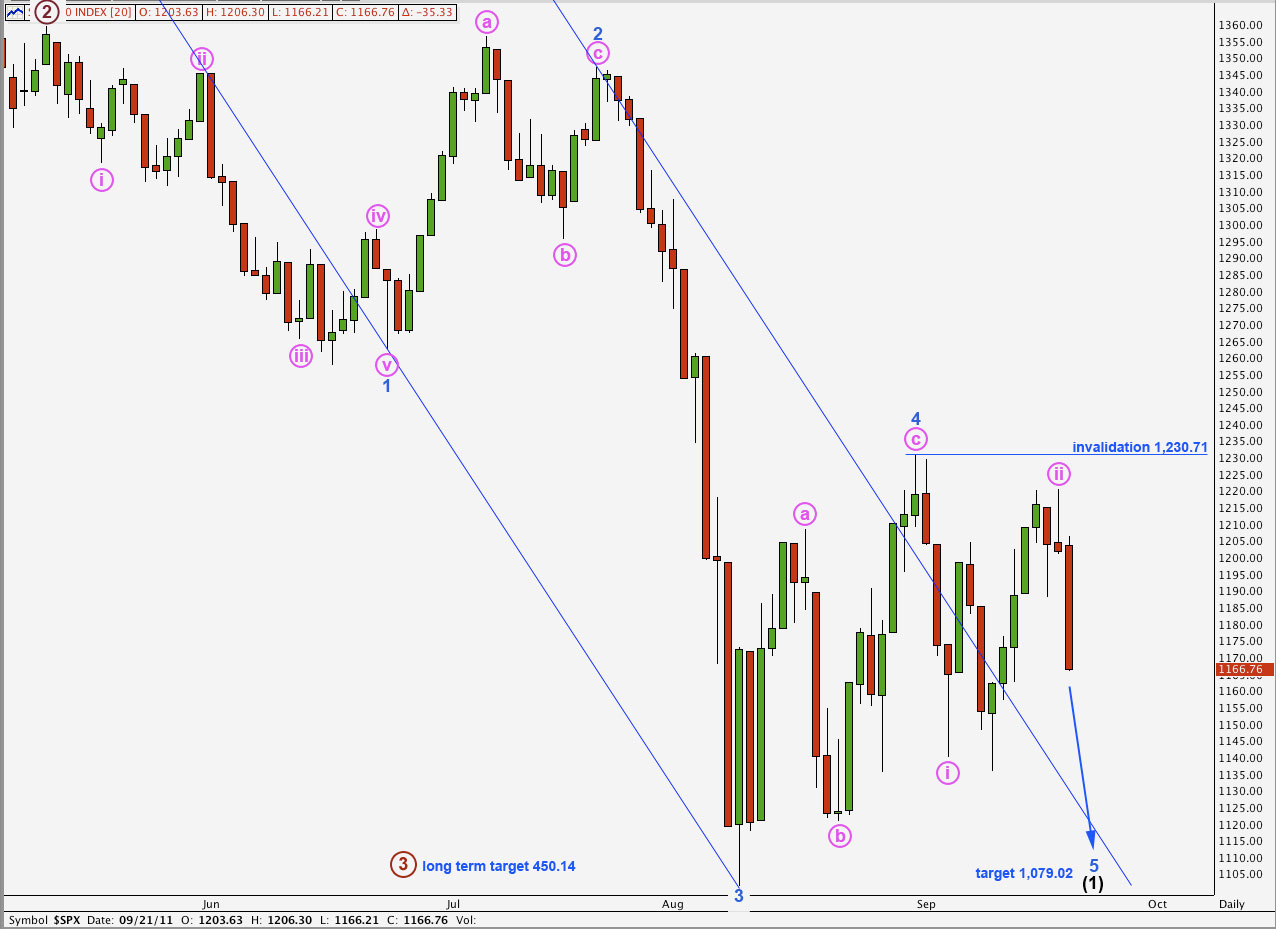
If downwards momentum is not as strong as our main wave count expects then this may provide a viable alternate. It also expects downwards movement to continue most likely to a new low.
At 1,079.02 wave 5 blue would reach 0.618 the length of wave 3 blue, the next likely Fibonacci ratio, because were it to only reach equality with wave 1 blue wave 5 blue would see a truncation.
Only movement above 1,230.71 would invalidate this wave count as any further extension upwards of wave ii pink may not move beyond the start of wave i pink.
If this wave count was correct then I would have expected price to continue to remain within the trend channel drawn here once the fourth wave was over. A fourth wave overshoot should be followed by price returning to the channel.
Also, wave b pink within wave 4 blue does not look like a b wave, nor does it easily subdivide into a zigzag. 5 minute charts for this piece of downwards movement are provided below to illustrate this point.
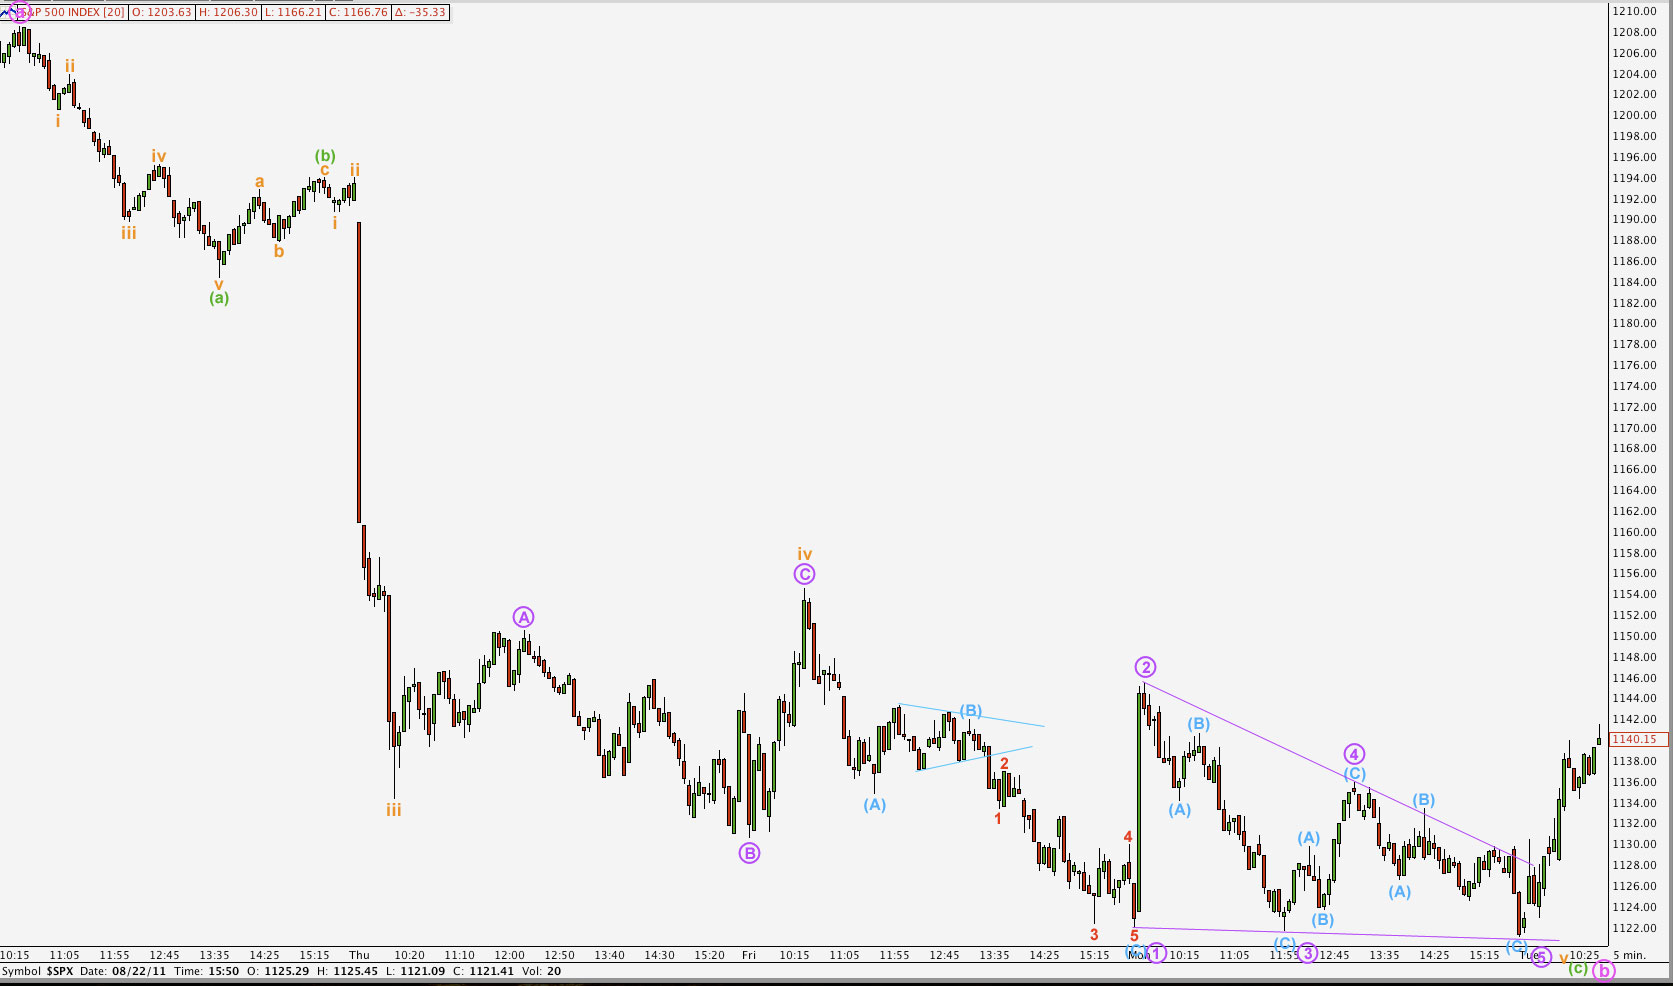
For this wave count to work this piece of movement for wave b pink here on the 5 minute chart must be seen as a zigzag.
Overall, the whole movement has a very good five wave look to it. However, in trying to see if the subdivisions fit as a count of 3 we can see a problem. Within wave iii orange of wave (c) green this piece of movement looks like a three, and this third wave should look like a five.
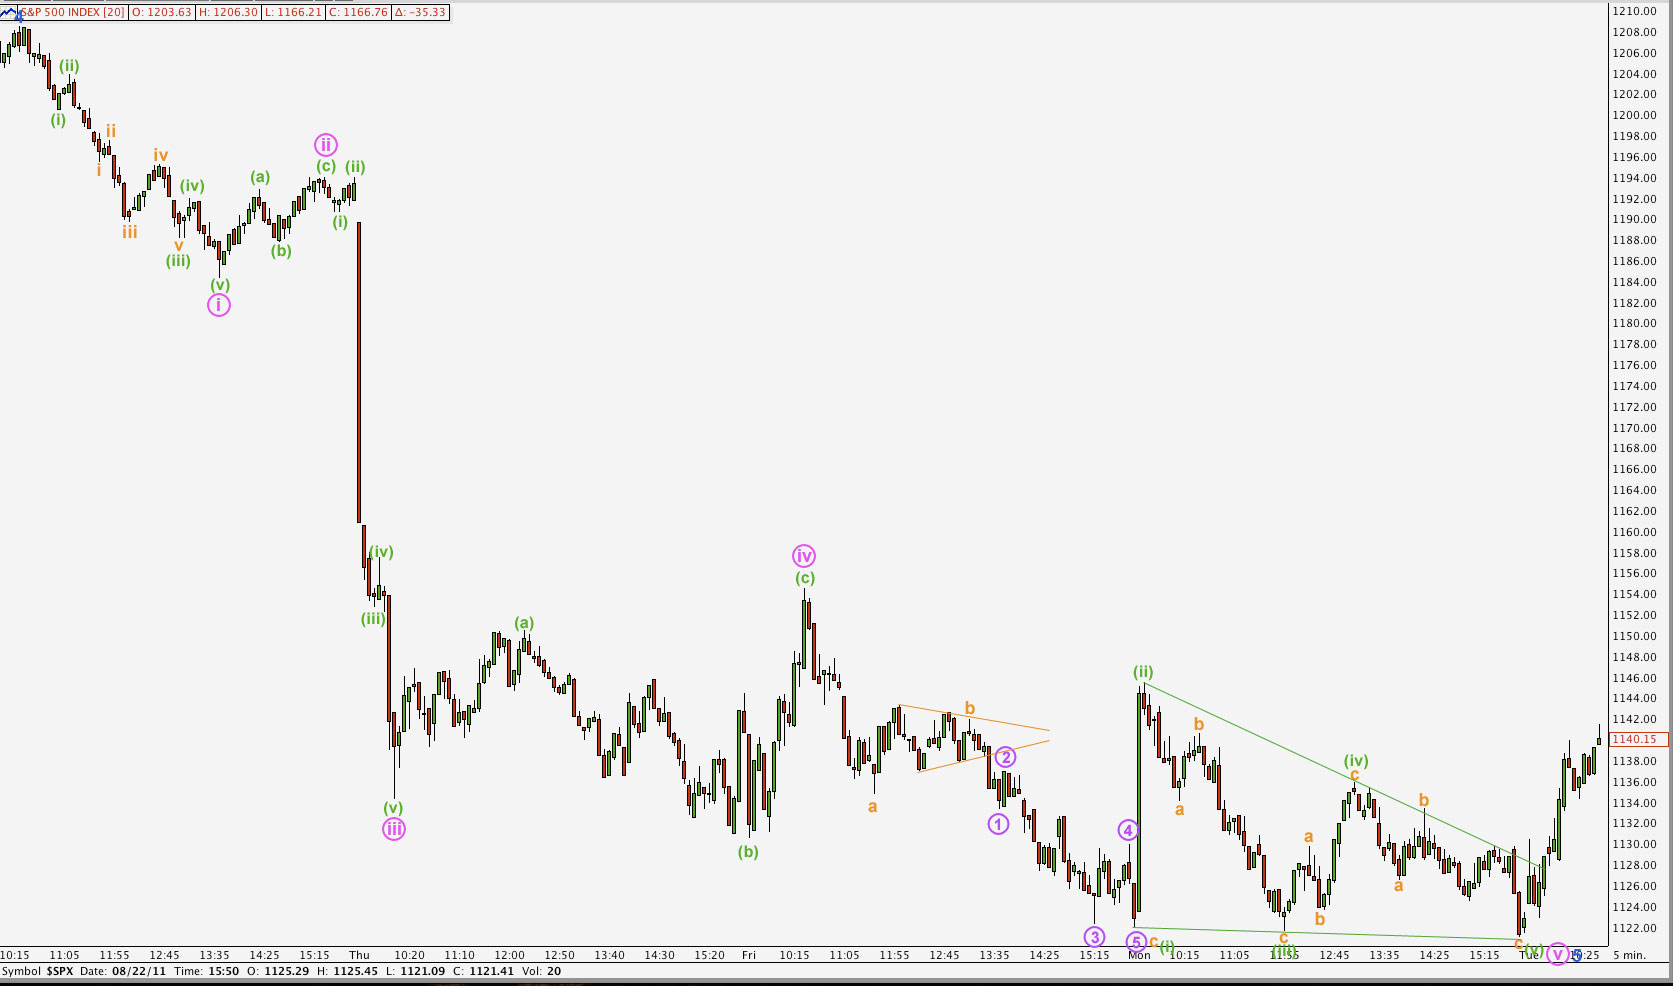
The 5 minute chart above looks at the same piece of movement, but for our main wave count. Here this movement is seen as a five, and every single subdivision works perfectly.
The strongest part of the movement is here seen as the middle of a third wave.