
Elliott Wave chart analysis for the S&P 500 for 19th September, 2011. Please click on the charts below to enlarge.
We expected overall upwards movement from the S&P 500 for Monday’s session, and we got some strong downwards movement. The first invalidation point on the hourly chart was breached but downwards movement ended before the second invalidation point was reached.
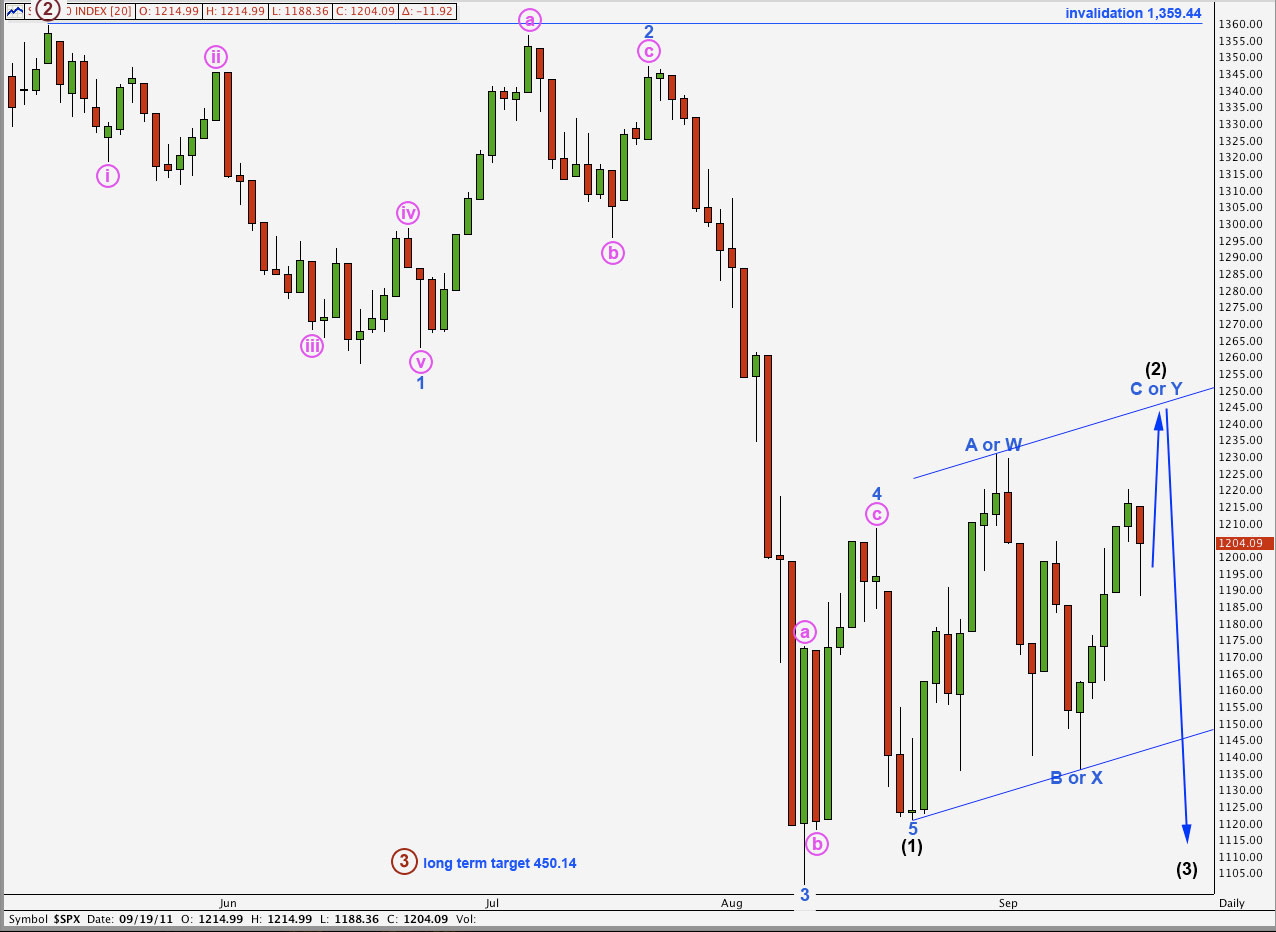
If this wave count is correct then the correction for wave (2) black is incomplete. We should see two more days most likely of more upwards movement before it is over.
Movement above 1,230.71 is not required for this wave count; wave C blue of a zigzag for (2) black may be truncated. However, movement above 1,230.71 would provide a lot of confidence in this wave count. At that stage any outlying alternate which saw wave (1) black as incomplete would be invalidated.
Main Hourly Wave Count.
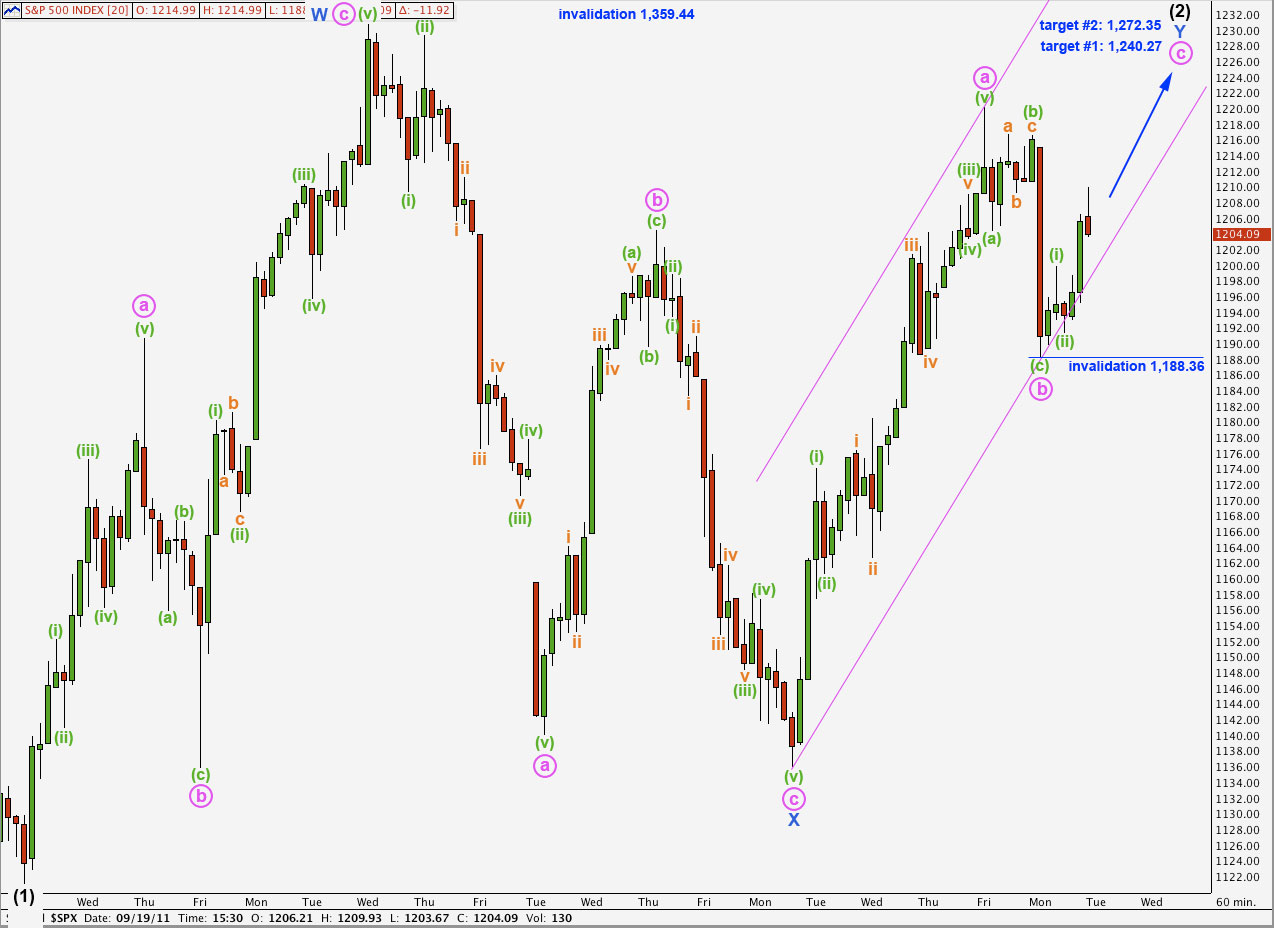
I have swapped the main and alternate wave counts over again today. This wave count looks slightly better than the alternate.
With Monday’s downwards movement showing up on the daily chart this wave Y blue now has a much better three wave look to it, which we should expect.
The end of wave a pink subdivisions look a bit forced though. The alternate has subdivisions which have a slightly better fit while this main hourly wave count has an overall look with a slightly better fit.
Ratios within wave a pink are: wave (iii) green has no Fibonacci ratio to wave (i) green, and wave (v) green is just 1.8 points short of 0.382 the length of wave (iii) green.
Within wave b pink there is no Fibonacci ratio between waves (a) and (c) green.
We may draw a parallel channel about this upwards zigzag using Elliott’s technique. We may expect wave c pink to be very likely to end about the upper edge of this channel.
At 1,240.27 wave c pink would reach 0.618 the length of wave a pink. This first target is more likely.
At 1,272.35 wave c pink would reach equality with wave a pink. This second target is less likely.
Within wave c pink no second wave correction may move beyond the start of the first wave. This wave count is invalidated with movement below 1,188.36.
Alternate Hourly Wave Count.
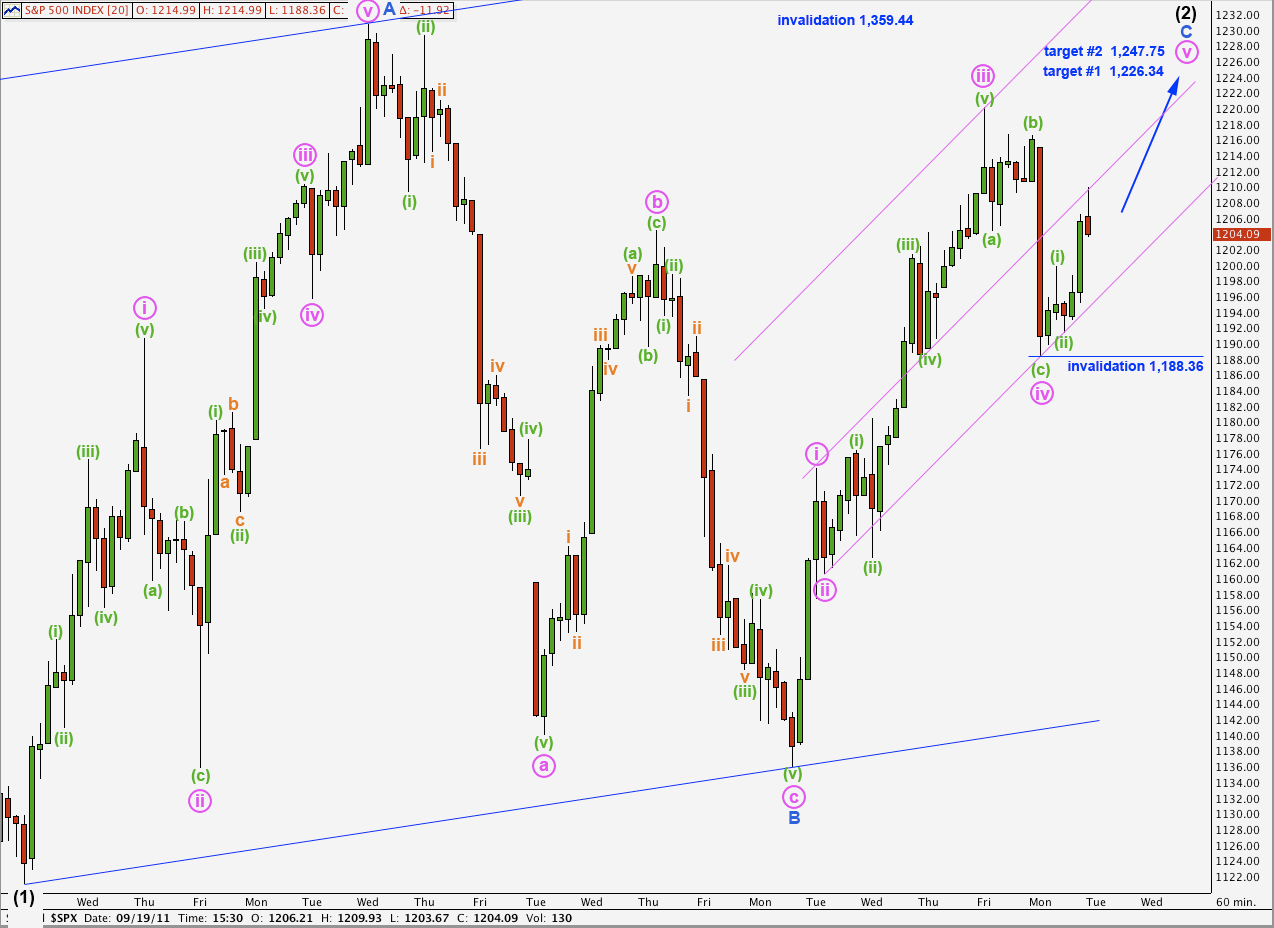
This alternate wave count has slightly more satisfactory subdivisions, but overall not as good a look as the main hourly wave count.
Within wave C blue to end the zigzag for wave (2) black wave v pink needs to complete a five wave structure upwards.
At 1,226.34 wave v pink would reach equality with wave i pink. This would see wave C blue slightly truncated, which is possible if there is enough downwards pressure to force a truncation.
At 1,247.75 wave v pink would reach equality with wave iii pink. Because this second higher target avoids a truncation it is more likely.
We may draw a channel about wave C blue using Elliott’s technique, and then create a double wide channel by placing a second parallel copy on the high of wave iii pink. Wave v pink may end about the mid line of this channel.
Within wave v pink no second wave correction may move beyond the start of the first wave. This wave count is invalidated with movement below 1,188.36.
If our hourly wave counts are invalidated with downwards movement tomorrow then either wave (2) black is complete or the wave counts is incorrect at blue and black degree. We would have to then more seriously consider the possibility that wave (1) black is incomplete and downwards movement may be wave 5 blue to end wave (1) black.