
Elliott Wave chart analysis for the S&P 500 for 16th September, 2011. Please click on the charts below to enlarge.
Our main hourly wave count after Thursday’s session expected further upwards movement, which is what we saw from the S&P 500 during Friday.
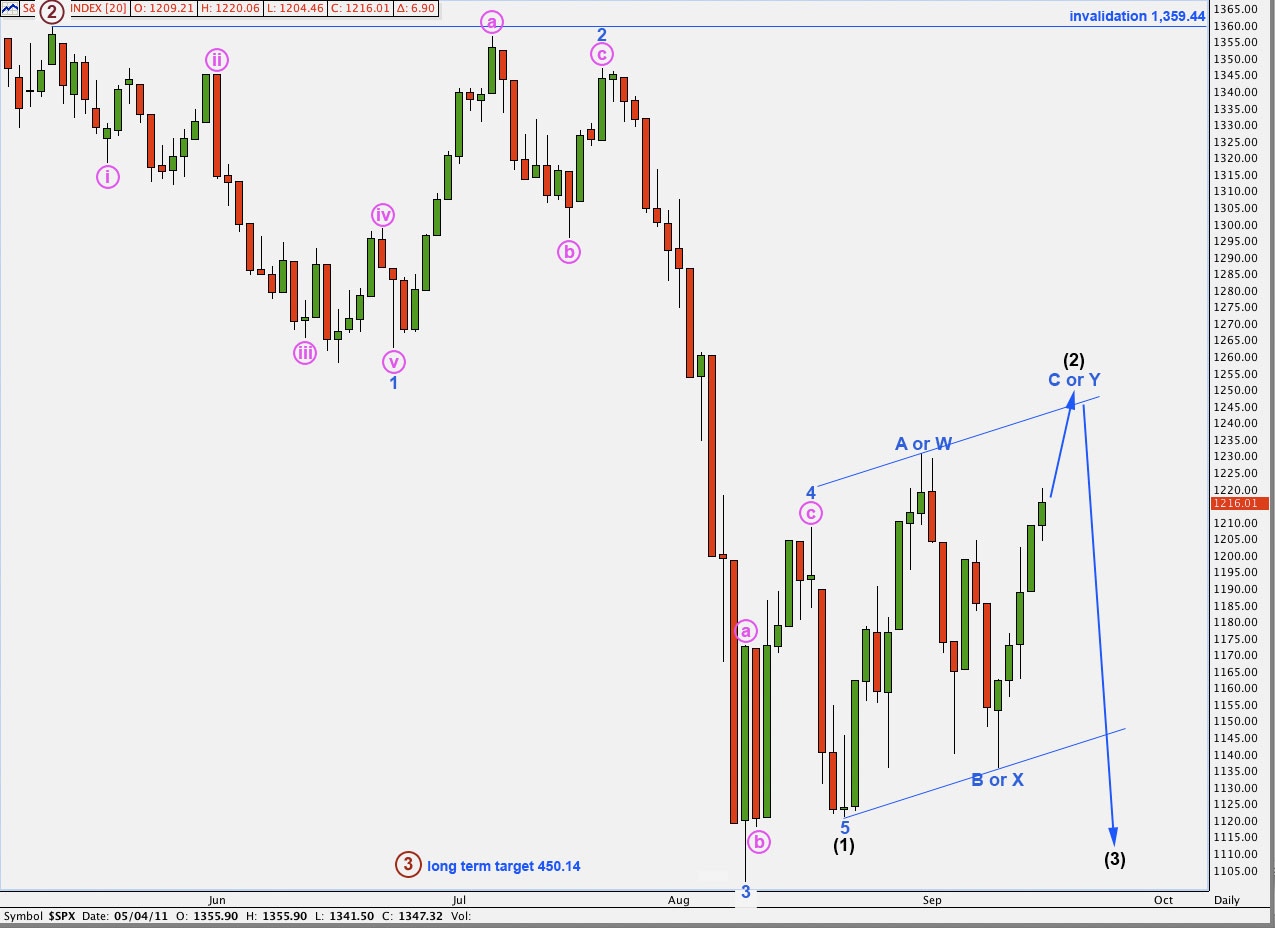
This wave count sees a large second wave correction for wave (2) black close to completion. Wave W (or A) blue within (2) black lasted a Fibonacci 8 days, as did wave X (or B) blue. If wave Y (or C) blue also lasts a Fibonacci 8 days it may end this Wednesday.
If wave (2) black is to achieve a typical look then upwards movement may end about the upper edge of the parallel channel containing it.
The next movement for the S&P 500, if this wave count is correct, should be a spectacular and explosive downwards movement.
If the next downwards movement does not exhibit third wave behaviour then we must consider an outlying alternate idea which sees only wave 5 blue downwards within (1) black as underway. Movement above 1,230.71 would invalidate this alternate idea. I will only chart and use this alternate idea if it shows itself to be correct.
Both our main and alternate hourly wave counts expect further upwards movement probably for another three days next week. Only targets and invalidation points differ.
Main Hourly Wave Count.
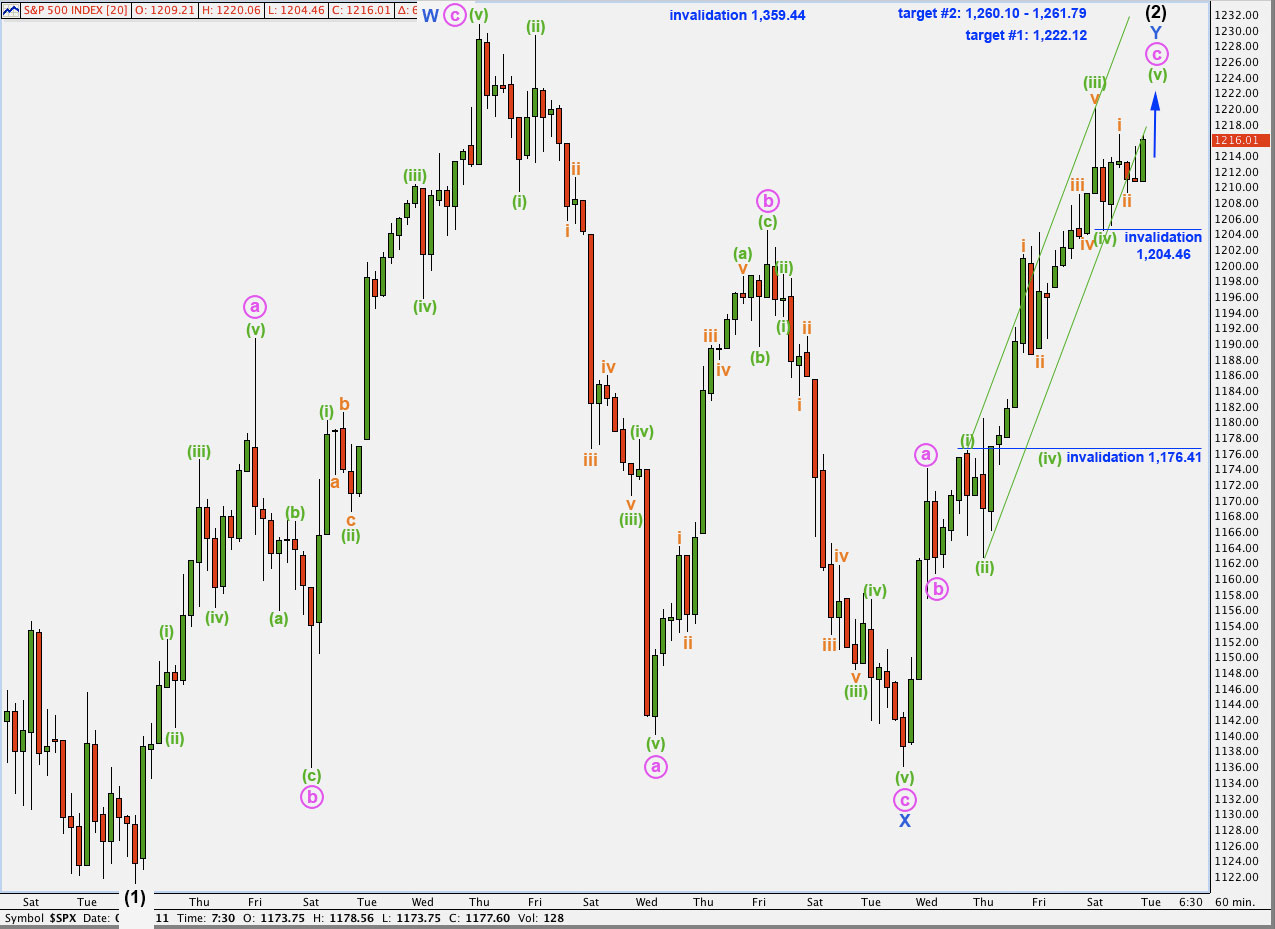
This main hourly wave count sees wave (2) black as a double zigzag structure.
The purpose of a double zigzag is to deepen a correction. We would expect wave Y blue to make a new high beyond the end of wave W blue above 1,230.71 if this wave count is correct. Failure to do so would significantly reduce the probability that this is the correct count.
Wave Y blue does not look like a typical zigzag structure anymore; it does not have an obvious three wave structure. This does not invalidate this wave count, but it does reduce its probability.
The final fifth wave up of wave c pink would be underway. At 1,222.12 wave c pink would reach 1.618 the length of wave a pink. This is our first, less likely, target for upwards movement to end.
At 1,260.10 wave c pink would reach 2.618 the length of wave a pink. This is fairly close to 1,261.79 where wave (v) green would reach equality with wave (iii) green within wave c pink. This gives us a small, more likely, target zone for upwards movement to end.
Wave (iii) green has no Fibonacci ratio to wave (i) green. This makes it more likely that wave (v) green will exhibit a Fibonacci ratio to either of (i) or (iii) green.
Ratios within wave (iii) green are: wave iii orange is 1.42 points longer than 0.618 the length of wave i orange, and wave v orange is just 0.28 points short of 0.618 the length of wave i orange.
If wave (iv) green is complete the following upwards movement for wave i orange has a good five wave structure on the 5 minute chart. Wave ii orange may not move beyond the start of wave i orange. This wave count is invalidated with movement below 1,204.46.
Wave (iv) green is a zigzag on the 5 minute chart, it is very likely it was over at 1,204.46. However, there is a possibility that this may have been only wave A within wave (iv) green for a flat correction. If this is the case and wave (iv) green extends lower then it may not enter the price territory of wave (i) green. This wave count is invalidated with movement below 1,176.41.
The first, higher invalidation point is most likely to hold during Monday’s session.
Alternate Hourly Wave Count.
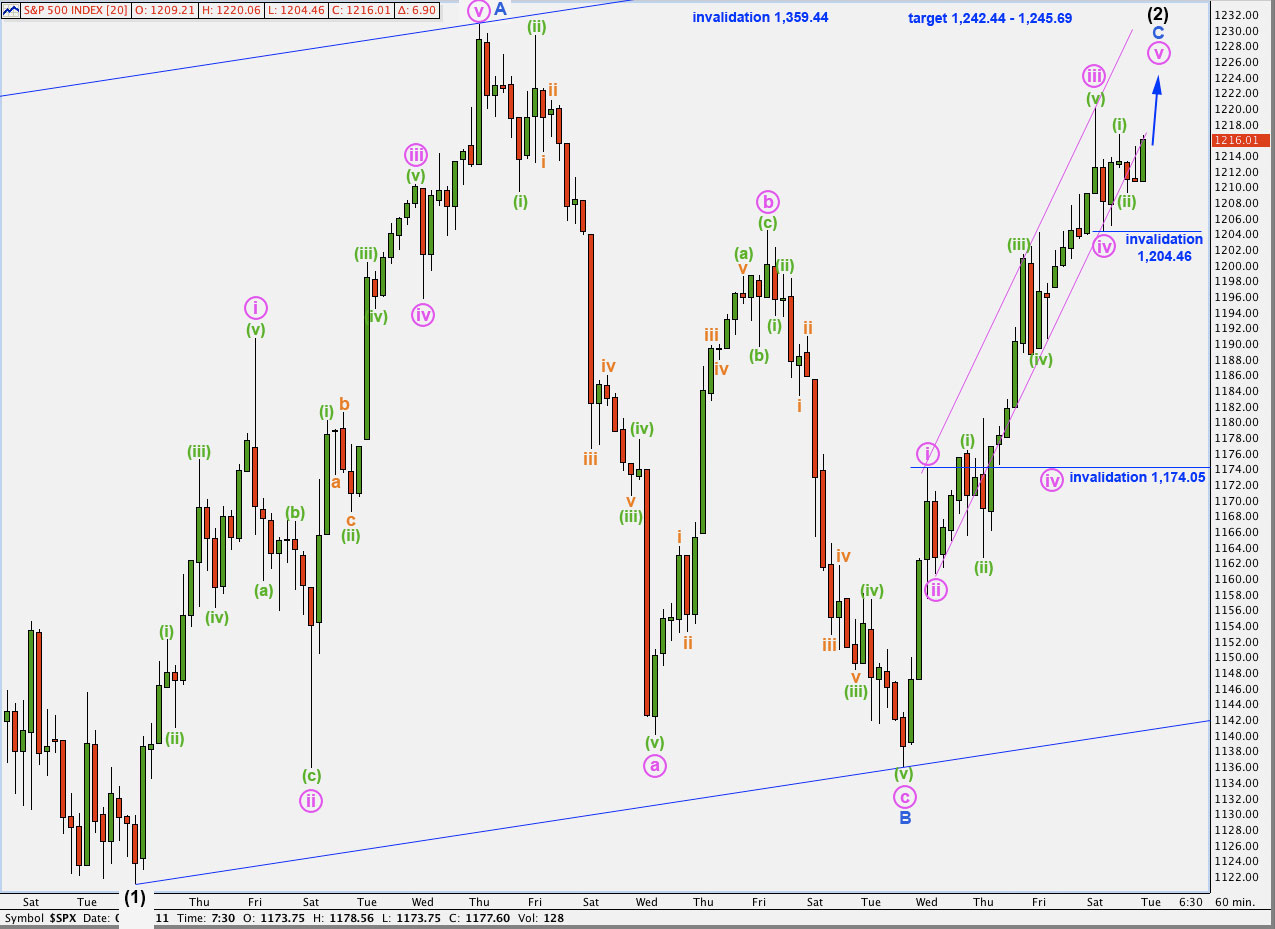
This alternate hourly wave count sees wave (2) black as a single zigzag structure.
Wave C blue must subdivide into a five wave structure, and here that structure is an impulse.
In terms of structure at this stage this wave count has a better look than the main hourly wave count.
Wave iii pink is 2.06 points short of 1.618 the length of wave i pink.
Ratios within wave iii pink are: wave (iii) green is 2.56 points short of 2.618 the length of wave (i) green, and wave (v) green has no Fibonacci ratio to either of (i) or (iii) green.
At 1,242.44 wave v pink would reach equality with wave i pink. This is fairly close to 1,245.69 where wave C blue would reach equality with wave A blue. This target zone has a high probability and would give this second wave zigzag a very typical look.
If wave iv pink is complete then wave (ii) green within wave v pink may not move beyond the start of wave (i) green. This wave count is invalidated with movement below 1,204.46.
If downwards movement labeled wave iv pink is just wave A of a flat correction for wave iv pink, then any extension lower of wave iv pink may not move into wave i pink price territory. This wave count is invalidated with movement below 1,174.05.