
Elliott Wave chart analysis for the S&P 500 for 14th September, 2011. Please click on the charts below to enlarge.
Yesterday’s analysis expected downwards movement (alternate hourly wave count) as most likely for Wednesday’s session. The S&P 500 moved higher during Wednesday’s session, not lower. Both our hourly wave counts remain valid and today they both expect the same direction of movement next: upwards.
In line with probability I have swapped the main and alternate hourly wave counts over today. Today the main hourly wave count looks the more likely of the two.
Yesterday’s analysis on the hourly charts relied upon MACD and the strong divergence seen there. I have learned again an important lesson with MACD: it should not be relied upon. We did see strong divergence with Tuesday’s price high having a significantly lower high on MACD than Monday’s price high. The divergence was very strong, but price continued higher anyway. I will remember this lesson in the future and use MACD as a guide only and not rely upon it. The wave count has primacy.
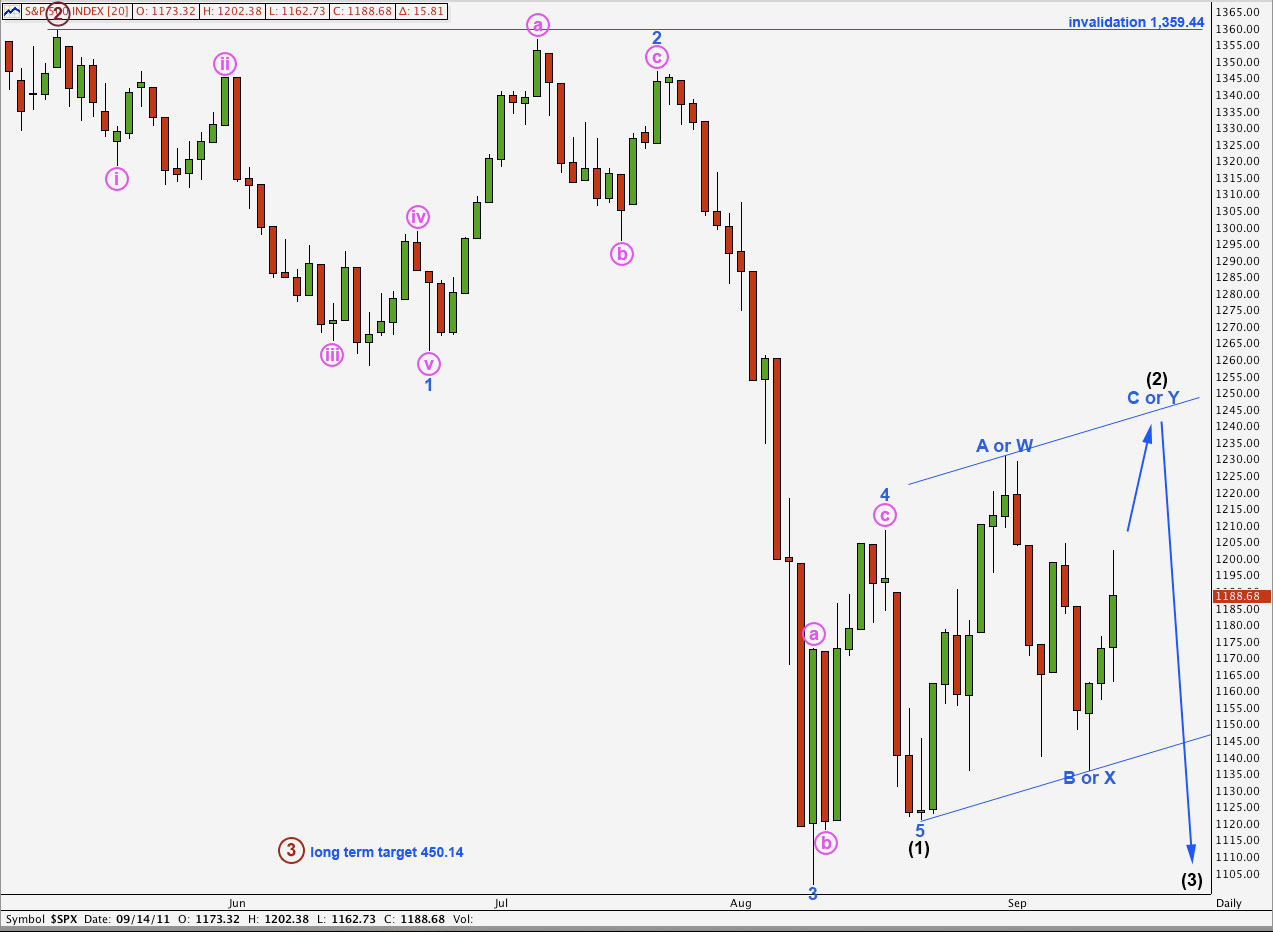
Wave (2) black may be either a single zigzag (alternate hourly wave count) or a double zigzag (main hourly wave count). Wave (2) black is well contained within the parallel channel here on the daily chart. When this channel is breached by downwards movement then wave (3) should be underway.
Wave (3) black to come should exhibit strong violent movement to the downside.
At 450.14 primary wave 3 will reach equality with primary wave 1 in length. When we have the end of wave (4) black within primary wave 3 we may refine this target.
Wave (2) black may not move beyond the start of wave (1) black. This wave count is invalidated with movement above 1,359.44.
Main Hourly Wave Count.
I am using MACD as a guide to which of our two hourly wave counts is more likely today. This is now our main, more likely wave count.
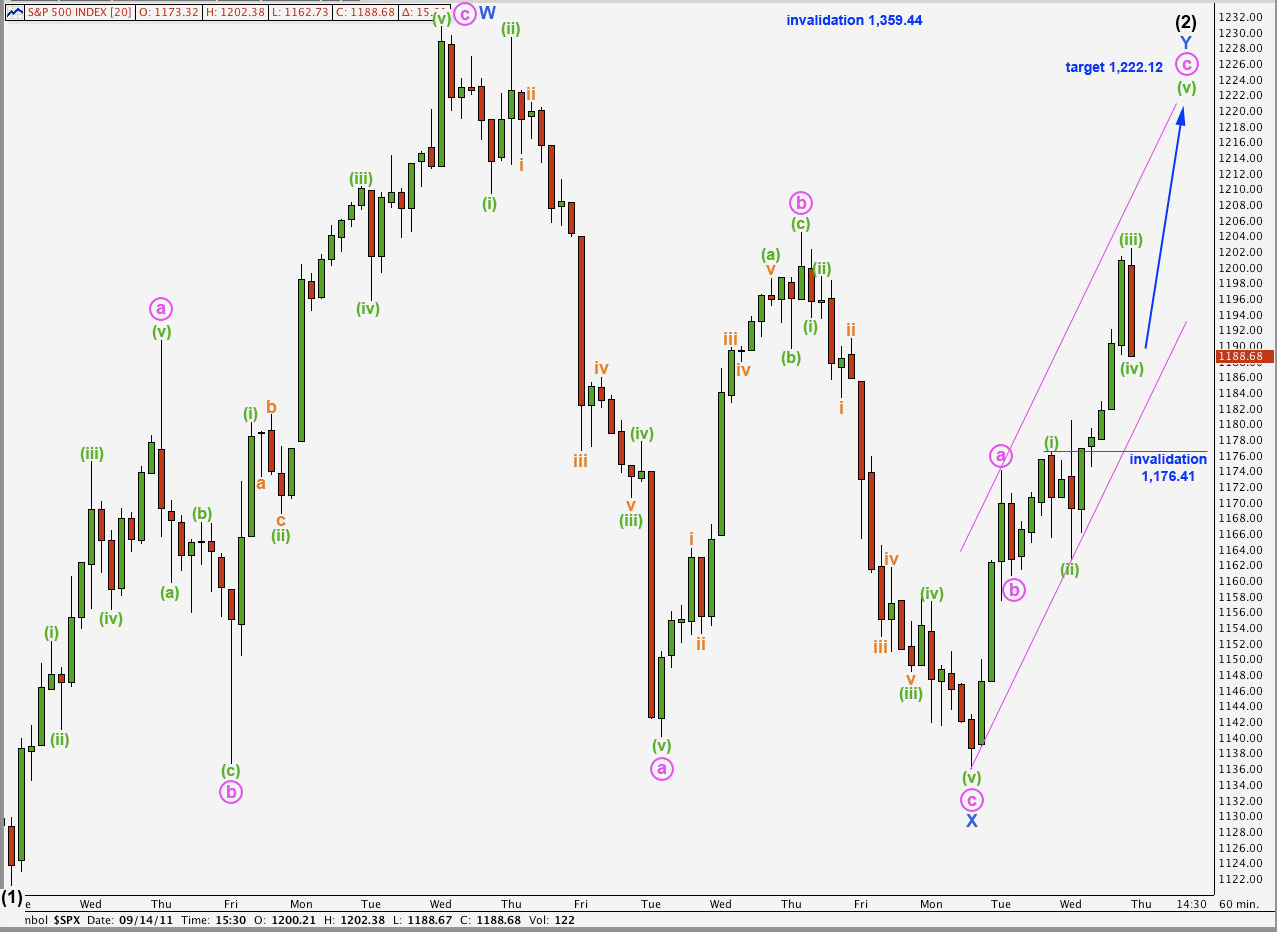
This wave count sees wave (2) black as a double zigzag structure. Because wave a pink within wave Y blue subdivided into a five wave impulse wave Y blue is a zigzag.
Wave c pink must subdivide into a five wave structure: either an ending diagonal or an impulse. An ending diagonal requires all subwaves to be zigzags, and wave (i) green is an impulse, therefore wave c pink will complete as a five wave impulse.
Wave (iv) green may not move into wave (i) green price territory. This wave count would be invalidated with movement below 1,176.41.
Within wave c pink wave (iii) green is just 1.56 points short of 2.618 the length of wave (i) green. With a close Fibonacci ratio between these waves we may not see a ratio between wave (v) green and either of (i) or (iii) green.
Wave c pink has already passed equality with wave a pink and its structure requires further upwards movement to complete it. At 1,222.12 wave c pink would reach 1.618 the length of wave a pink.
The channel drawn about wave Y blue is not Elliott’s technique but it is a good fit. Wave c pink may end about the upper edge of this channel, and when the channel is breached by downwards movement then we may have seen the end to wave Y blue and so (2) black.
Alternate Hourly Wave Count.
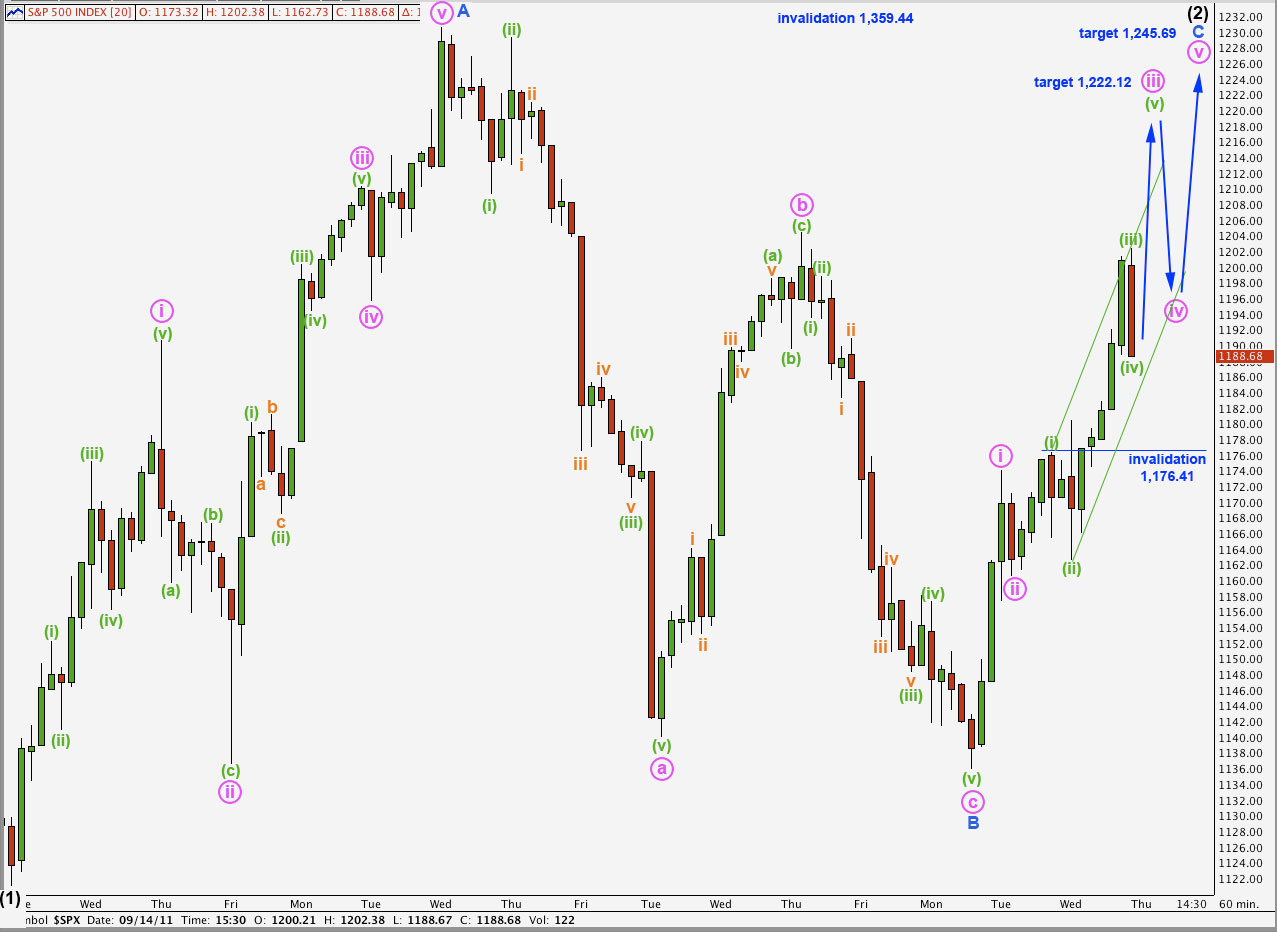
This wave count sees wave (2) black completing a single zigzag structure.
Wave C blue must subdivide into a five wave structure, either an ending diagonal or an impulse. It is an impulse because the first wave upwards was a five wave impulse and not a zigzag.
At 1,222.12 wave iii pink would reach 1.618 the length of wave i pink. This is our target for upwards movement to probably be reached tomorrow.
Any further downwards movement of wave (iv) green may not move into wave (i) green price territory. This wave count is invalidated by movement below 1,176.41.
When wave iii pink is complete then the invalidation point must move down to the high of wave i pink at 1,174.05.
We may use Elliott’s channeling technique around wave iii pink to show us where wave (v) green may end. When this small channel is breached by downwards movement then this third wave is complete and the fourth wave at pink degree may then be underway.
The end target for wave C blue is at 1,245.69 where it would reach equality in length with wave A blue.