Elliott Wave chart analysis for the S&P 500 for 13th September, 2011. Please click on the charts below to enlarge.
As expected after yesterday’s analysis the S&P 500 moved higher during Tuesday’s session.
Both our hourly wave counts remain valid and at this stage they diverge in expectations for the next movement. The alternate is looking more likely at this stage.
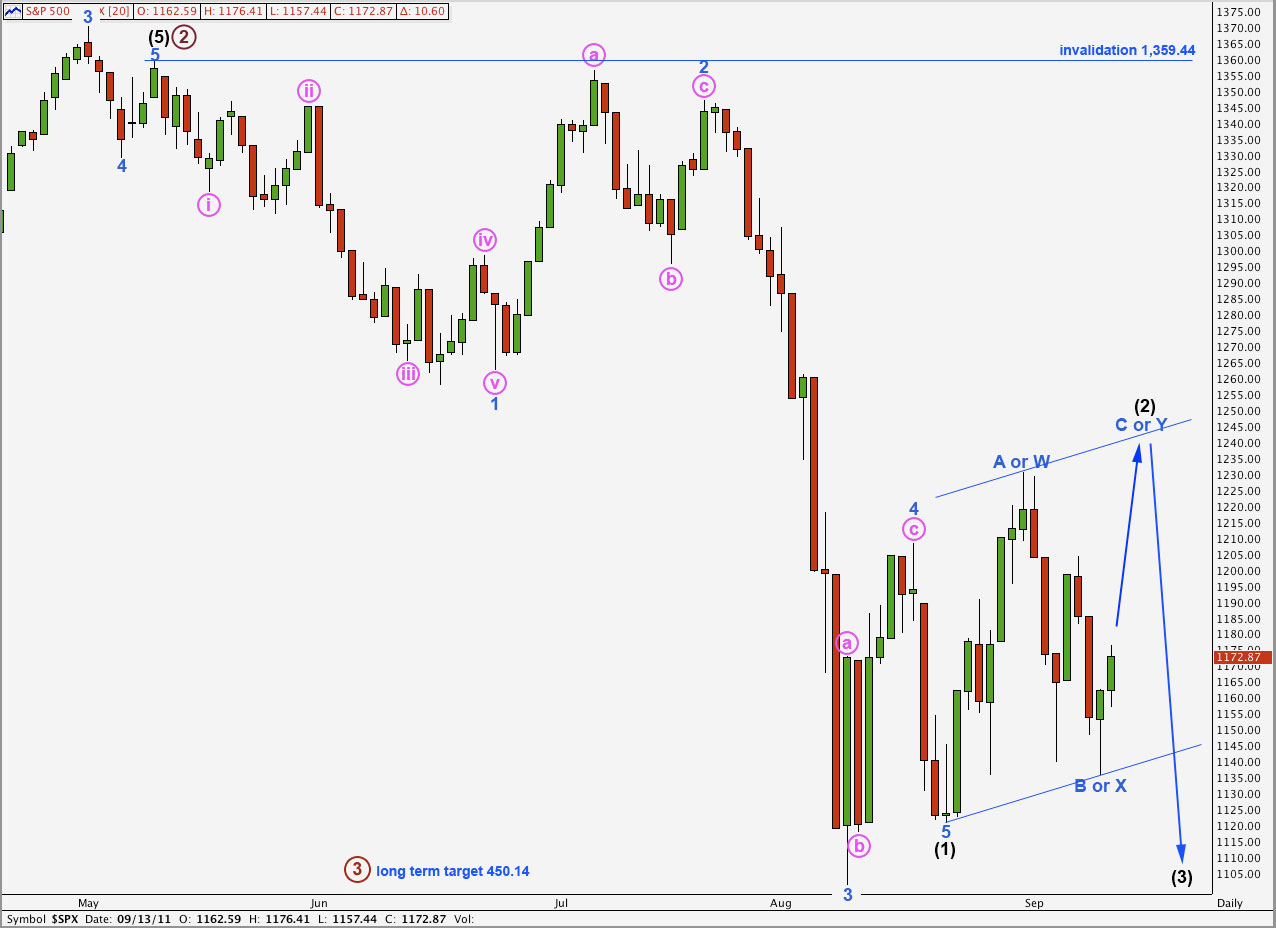
Wave (2) black may be either a zigzag or a double combination. If it is a double combination it is likely to be a zigzag – X – flat. Wave (2) black is well contained within the parallel channel here on the daily chart. When this channel is breached by downwards movement then wave (3) should be underway.
Wave (3) black to come should exhibit strong violent movement to the downside.
At 450.14 primary wave 3 will reach equality with primary wave 1 in length. When we have the end of wave (4) black within primary wave 3 we may refine this target.
Wave (2) black may not move beyond the start of wave (1) black. This wave count is invalidated with movement above 1,359.44.
Main Hourly Wave Count.
This main hourly wave count today looks less likely than the alternate.
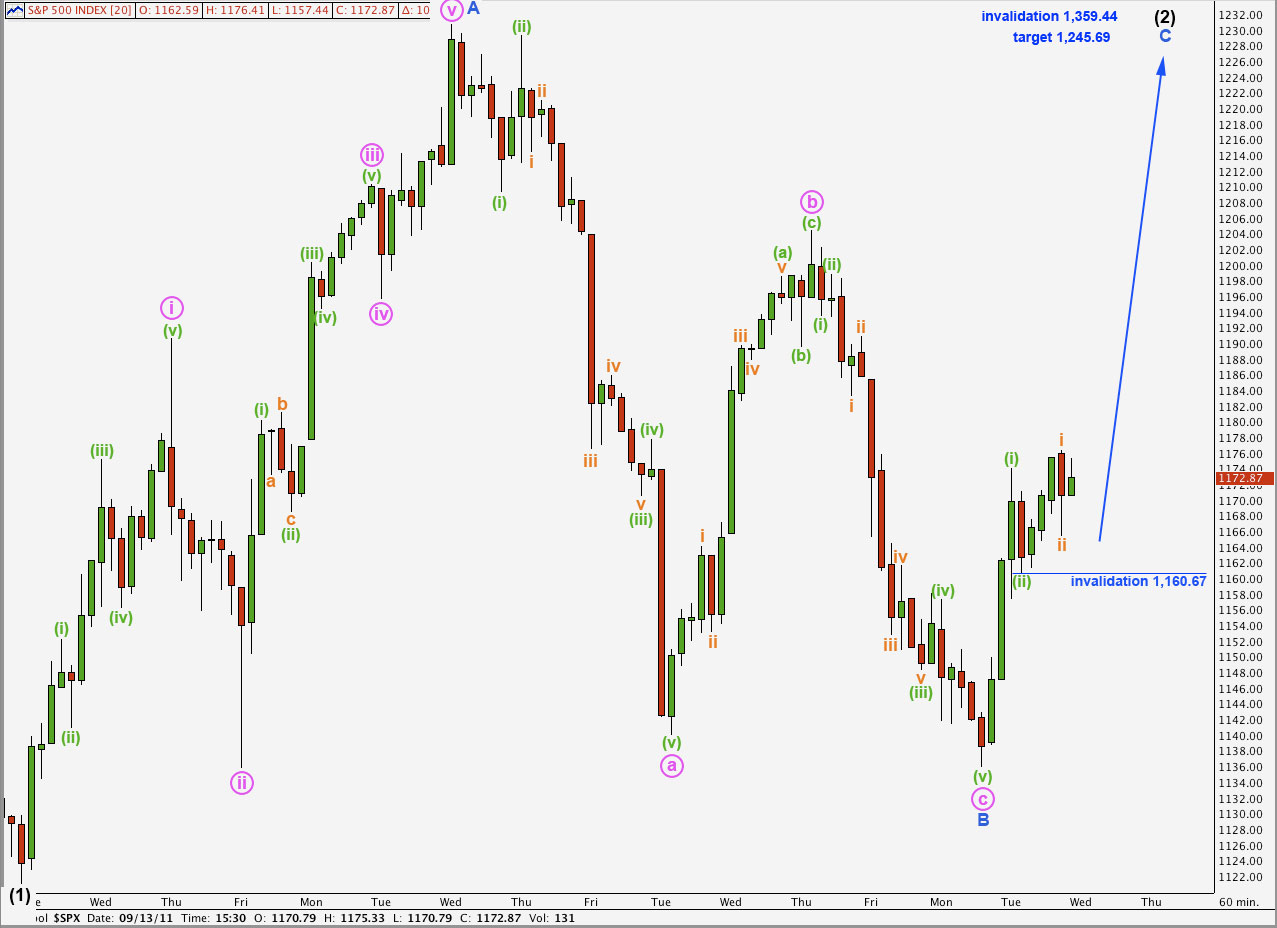
This main hourly wave count sees wave (2) black as a simple zigzag. Waves A and B blue are complete and wave C blue must subdivide into a five wave structure.
Wave C blue may be either an ending diagonal or an impulse. An ending diagonal requires all subwaves to be zigzags, and wave (i) green upwards is clearly an impulse therefore wave C blue is subdividing as an impulse.
Within an impulse we would expect momentum to increase as price moves into the middle of a third wave and here there is strong divergence between the highs of (i) green and i orange with MACD trending lower. This does not fit with this wave count, reducing its probability.
If this wave count is correct then momentum should increase with further upwards movement. Wave C blue is very likely to make a new high above the end of wave A blue at 1,175.33, but it does not have to.
At 1,245.69 wave C blue would reach equality in length with wave A blue.
Any further extension of wave ii orange downwards may not move beyond the start of wave i orange. This wave count is invalidated with movement below 1,160.67.
Alternate Hourly Wave Count.
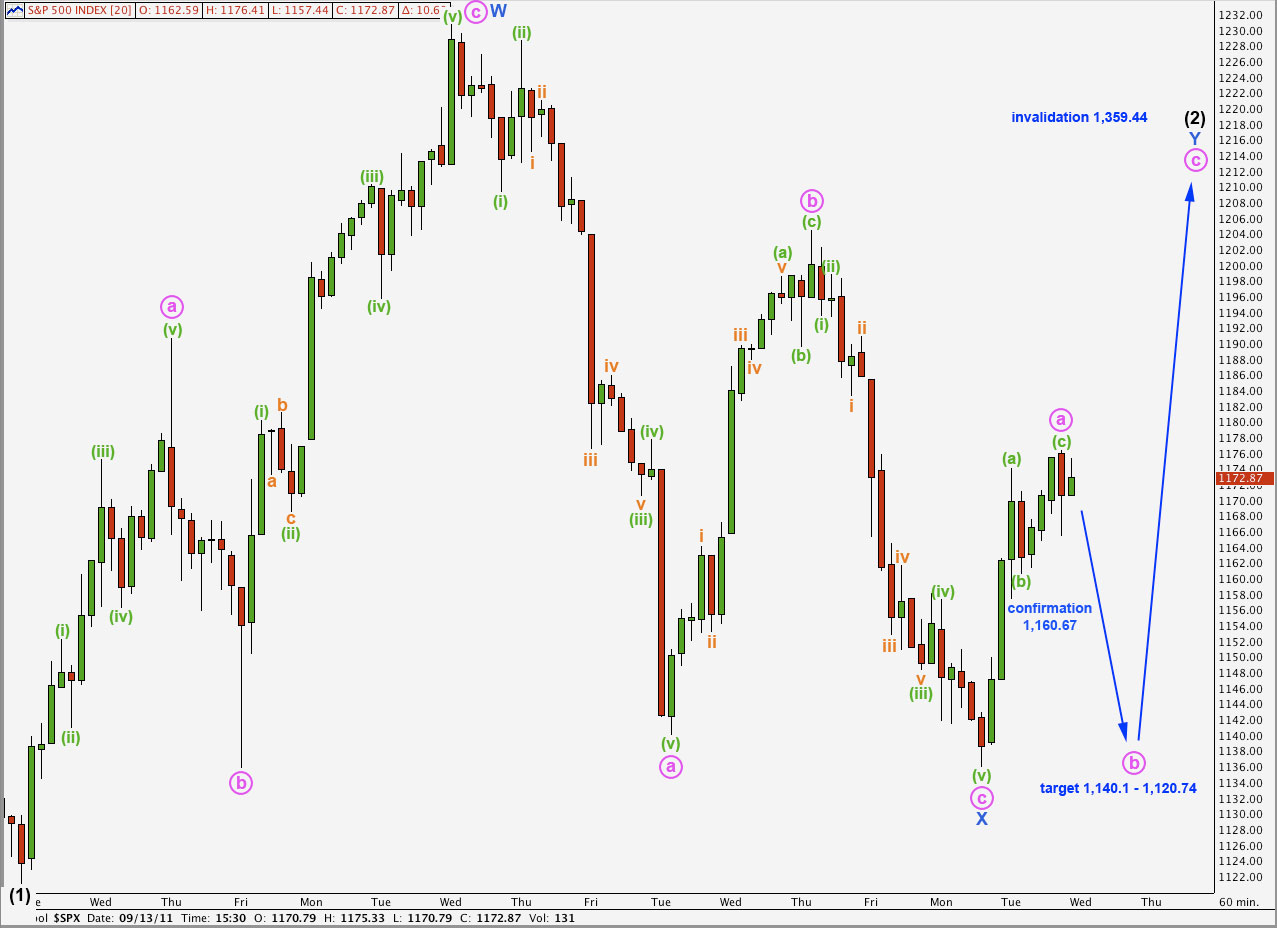
With strong divergence towards the end of Tuesday’s upwards movement labeled wave a pink this wave count has a higher probability today than the main wave count.
Within wave a pink wave (c) green is just 1.23 points longer than 0.382 the length of wave (a) green.
Movement below 1,160.67 would confirm this alternate as at that stage the main wave count would be invalidated.
At that stage we should expect price to continue lower to at least 1,140.10 where wave b pink would reach 90% the length of wave a pink. Wave b pink would probably not be longer than 138% the length of wave a pink and so probably not move below 1,120.74.
Wave a pink is likely to be over at 1,176.41, but it is also possible that wave (c) green may continue higher. While price remains above 1,160.67 this possibility will remain. Movement below 1,160.67 will confirm that wave a pink was a three wave structure and is complete.


