
Elliott Wave chart analysis for the S&P 500 for 12th September, 2011. Please click on the charts below to enlarge.
My analysis of some recent movement was wrong and our hourly wave count was invalidated by downwards movement during Monday’s session.
Wave behaviour is inconsistent with yesterday’s alternate wave count. This is not a third wave within a third wave downwards because momentum is not strong enough and corrections are too deep.
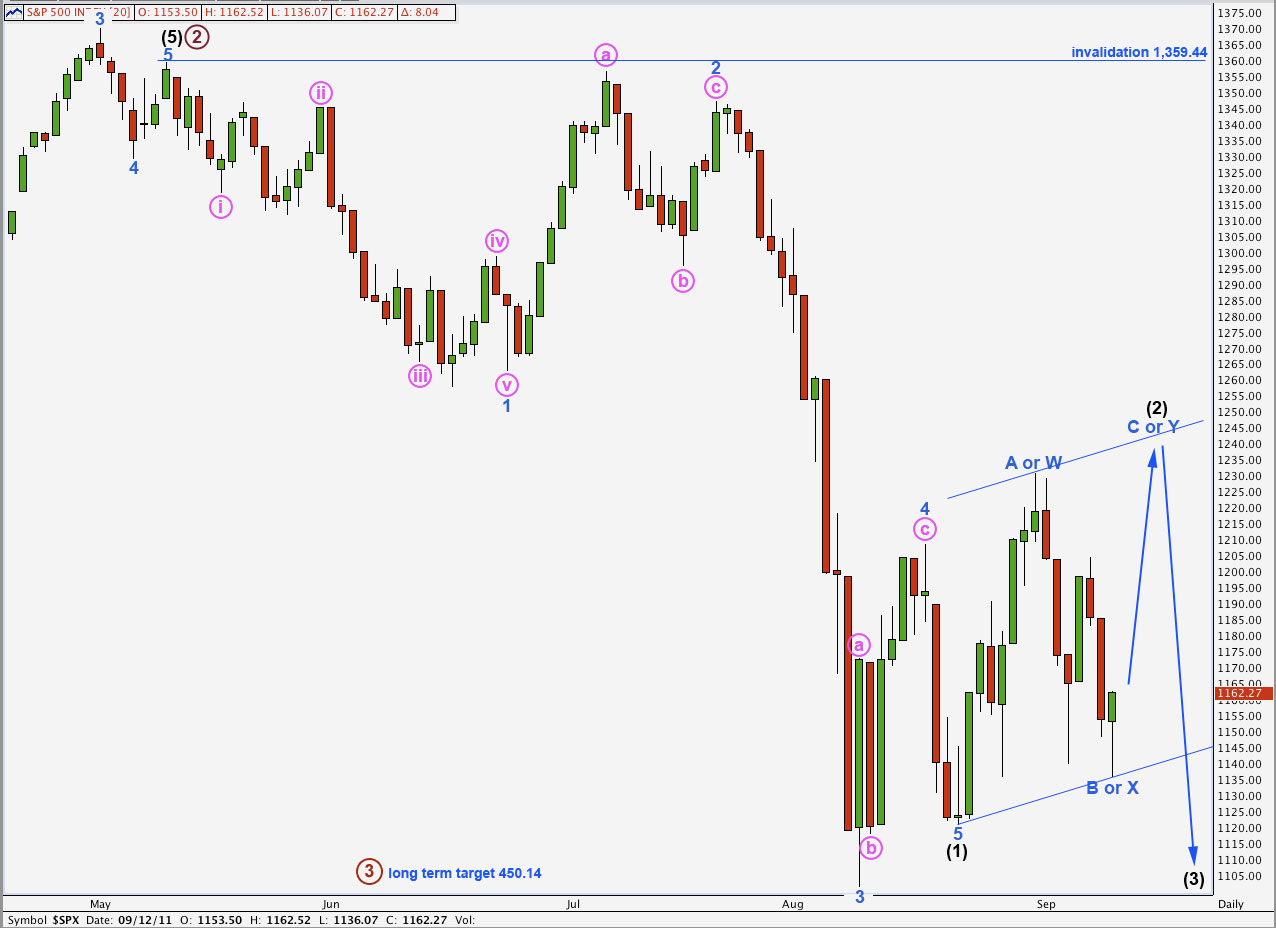
I have again considered the possibility that wave (1) black is incomplete. This idea requires the downwards wave labeled 5 blue of (1) black to be seen as wave b within 4 blue, i.e. it must be seen as a three wave structure. I have gone back to a 5 minute chart for this piece of movement and have come to the same conclusion I did at the time: it is a five and not a three. Therefore, wave (1) black must be over and the S&P is within wave (2) black.
Wave (2) may not move beyond the start of wave (1) black. This wave count is invalidated with movement above 1,359.44.
Main Hourly Wave Count.
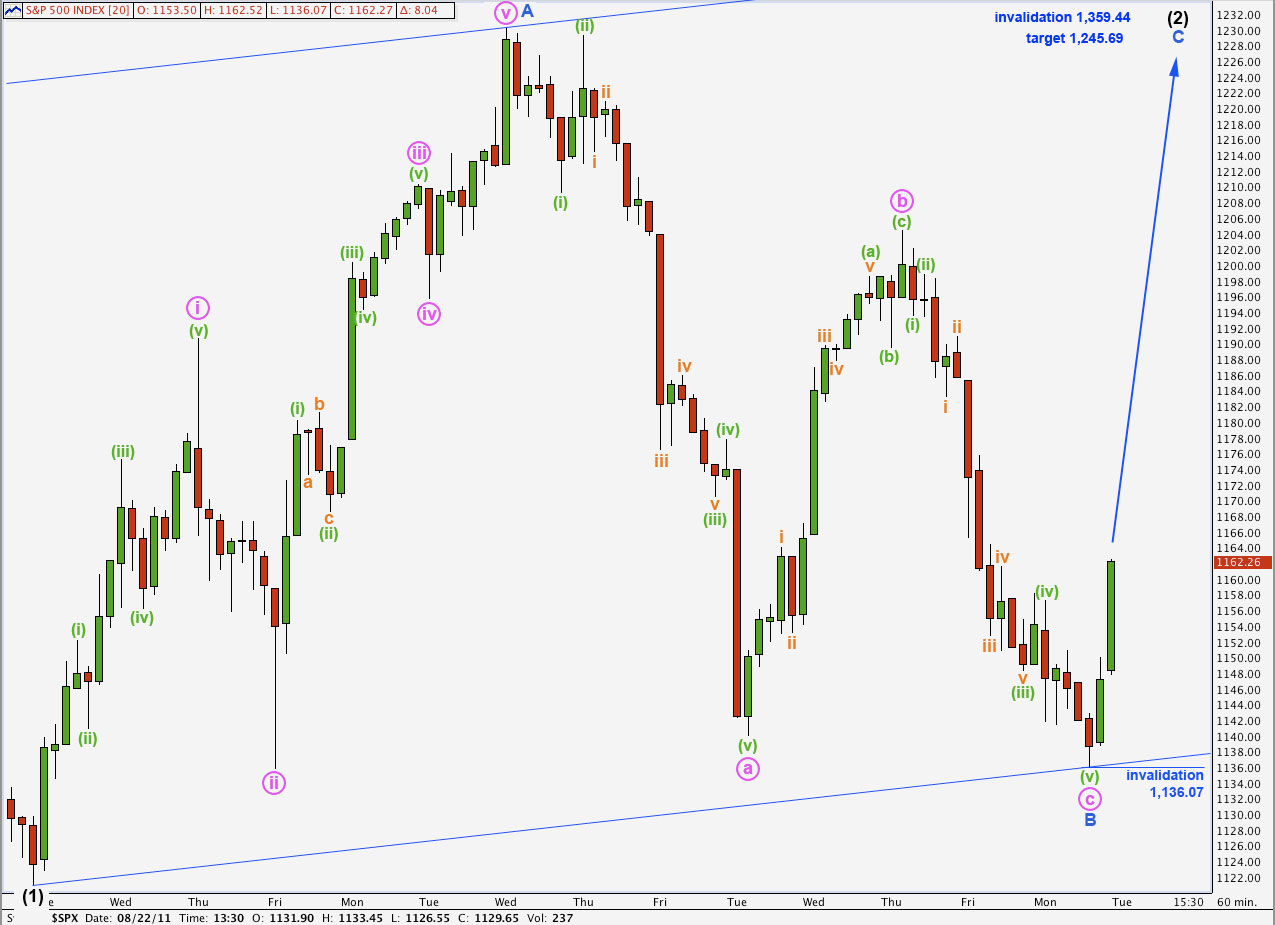
This hourly chart shows all movement since the end of wave (1) black with its truncated fifth wave.
The piece of analysis, which I must have had wrong, is the downwards wave labeled a pink. This must be a five and not a three, and is only wave a within wave B blue.
Wave B blue is now an obvious looking three wave structure lasting a Fibonacci 8 days.
Wave C blue would reach equality with wave A blue at 1,245.69, and if it too lasted a Fibonacci 8 days it may end Wednesday 21st September. Price relationships are more reliable than time though; this date is only a possibility and may not be relied upon too heavily.
This wave count sees the wave down labeled a pink within B blue as a five wave structure, whereas last analysis saw it as a three. Unfortunately, particularly within corrections, threes and fives are not always as clear as we would like them to be and this is the source of most errors and invalidations.
If this wave count is correct then within wave C blue no second wave correction may move beyond the start of its first wave. This wave count is invalidated with movement below 1,136.07.
Alternate Hourly Wave Count.
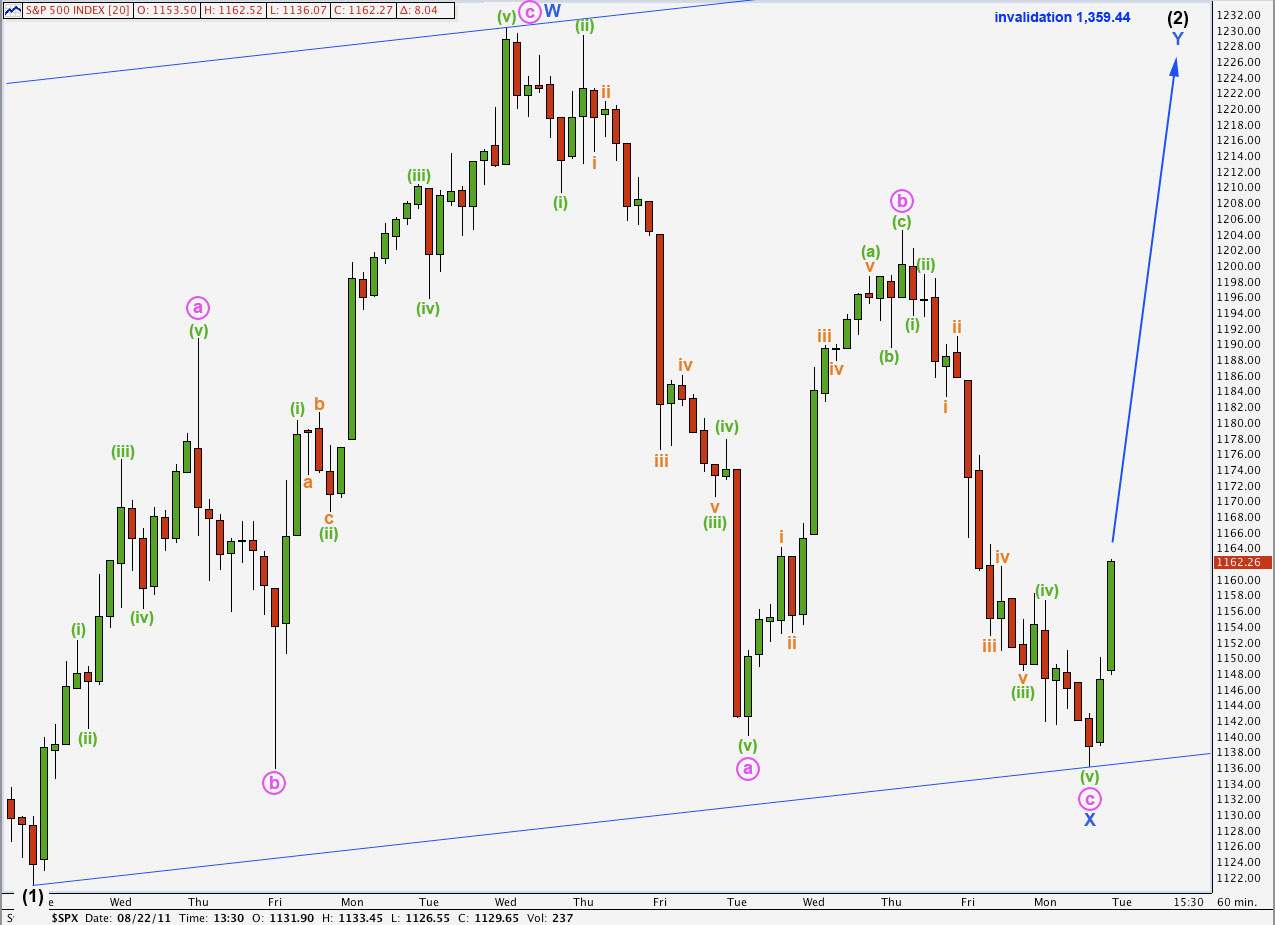
Alternately, if the first wave upwards was a three then wave (2) black may be either a double zigzag or a double combination structure.
We must consider this possibility because the wave upwards labeled W blue has a three wave look to it. Although, again, it is ambiguous and may be seen as a three or a five.
If wave (2) black is a double then the second structure labeled Y blue may be either a zigzag, a flat, or a triangle. A zigzag is the most likely structure an a triangle is the least likely.
Unfortunately, this wave count has no downwards invalidation point. If wave Y blue is an expanded flat or running triangle then we may see a new low below 1,136.07. This would invalidate the main hourly wave count and confirm this alternate.
Wave Y blue has no target yet because there is not enough of its structure to calculate one. It is unlikely to have a Fibonacci ratio to wave W blue. Wave Y blue is fairly likely to make a new high above the end of wave W blue at 1,230.71, but it does not have to.