
Elliott Wave chart analysis for the S&P 500 for 8th September, 2011. Please click on the charts below to enlarge.
The S&P 500 did not behave exactly as we expected for Thursday’s session as a small second wave correction moved price a little lower. However, we had understood that this could happen and I just expected it to be very unlikely. Price remains above the invalidation point and the wave count still looks still typical.
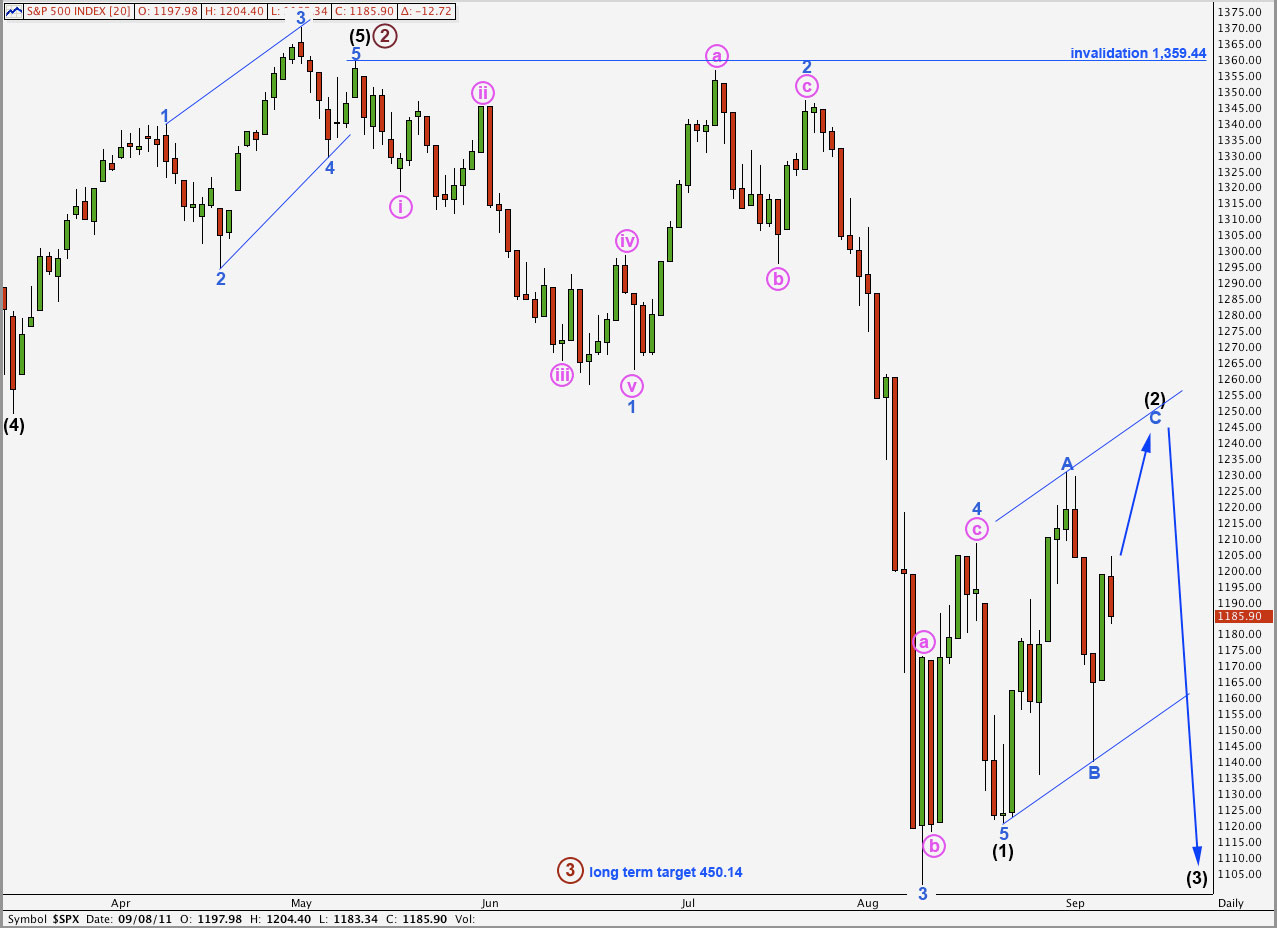
Wave A blue lasted a Fibonacci 8 days. If wave C blue lasts also a Fibonacci 8 days it may end next Thursday, 15th September. This would give wave (2) black zigzag a typical look on the daily chart.
Wave C blue may come to touch the upper edge of the parallel channel drawn here about wave (2) black. When this channel is breached by downwards movement then we may use that as confirmation that wave (2) black is over and wave (3) black is underway.
Wave (3) black may exhibit violent and explosive movement to the downside. Momentum should increase over that seen within wave (1) black downwards.
Wave (2) may not move beyond the start of wave (1) black. This wave count is invalidated with movement above 1,359.44.
In the long term primary wave 3 would reach equality with primary wave 1 at 450.14. When waves (3) and (4) black are complete we may refine this target.
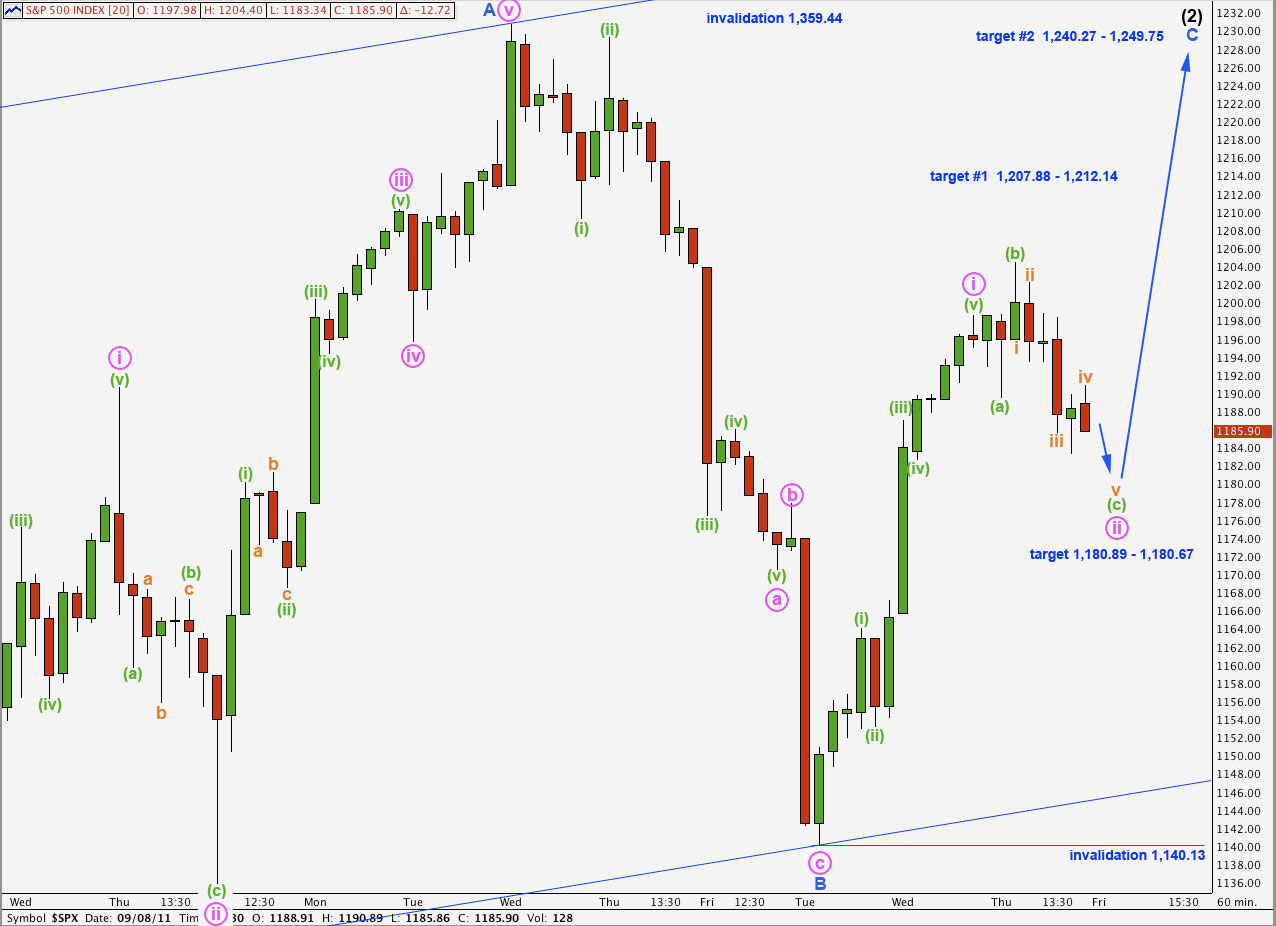
I had expected it was most likely that wave ii pink was over. This was not the case and wave ii pink is extending as an expanded flat correction.
Wave (b) green is a 165% correction of wave (a) green. At 1,180.89 wave (c) green would reach 2.618 the length of wave (a) green.
Within wave (c) green I have determined the labeling of orange waves after careful examination of a 5 minute chart. Wave iii orange has no Fibonacci ratio to wave i orange. This makes it more likely that wave v orange will exhibit a Fibonacci ratio to either of i or iii orange. At 1,180.67 wave v orange would reach 0.618 the length of wave iii orange. This is extremely close to the target calculated at green degree and so this target zone has a high probability.
When wave ii pink is complete the S&P should turn upwards for wave iii pink. Momentum should increase a little to the upside during Friday’s session.
The first target zone for wave C blue to complete wave (2) black is at 1,207.88 where wave C blue would reach 0.618 the length of wave A blue, this is close to the 0.382 Fibonacci ratio of wave (1) black at 1,212.14.
The second target zone for wave C blue to complete wave (2) black is at 1,249.75 where wave C blue would reach equality with wave A blue, which is close to the 0.5 ratio of wave (1) black at 1,240.27.
Wave ii pink may not move beyond the start of wave i pink. This wave count is invalidated with movement below 1,140.13.