
Elliott Wave chart analysis for the S&P 500 for 1st September, 2011. Please click on the charts below to enlarge.
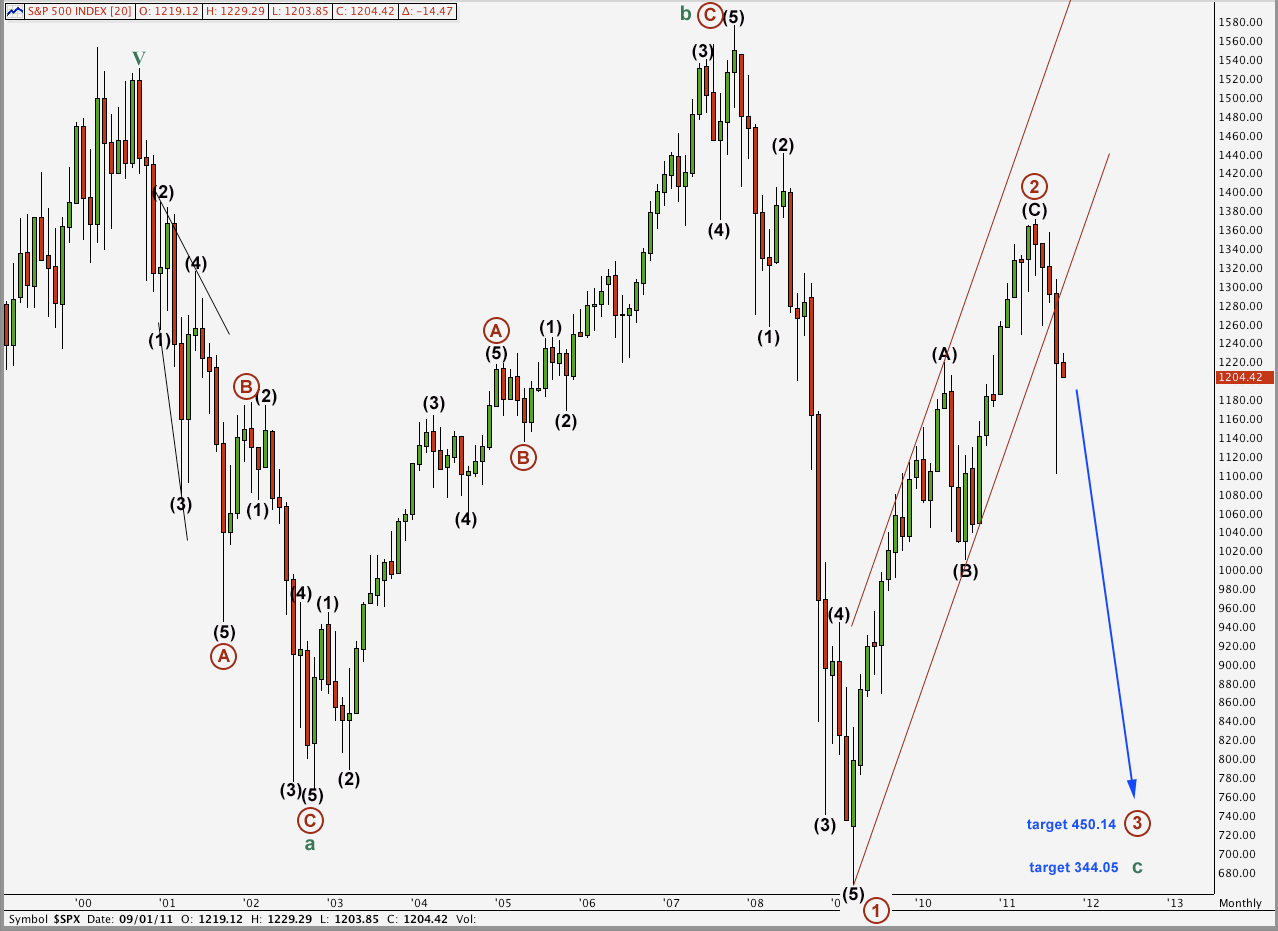
I am changing the wave count today back to this previous historic wave count, which is the same as Prechter’s wave count.
I am doing this today because the degrees fit so much better. I did not feel comfortable with intermediate waves which were lasting only days. This wave count has a better fit and look in that respect.
The end of cycle wave v is slightly truncated.
At super cycle degree this wave count sees the correction as beginning at 1,530.09 in September 2000. This is a super cycle expanded flat correction. Cycle wave b was a 106% correction of cycle wave a meeting the requirements for an expanded flat. We may expect cycle wave c to be about 1.618 the length of cycle wave a. This is achieved at 344.05. The whole movement may end about this point.
Primary wave 1 within cycle wave c looks most easily like a five wave impulse and so we may expect that cycle wave c will unfold as an impulse, and not an ending diagonal.
Primary wave 3 will reach 1.618 the length of primary wave 1 at 450.14. This was also our target for the last wave count, and this mid to long term expectation has not changed. What happens after this wave down ends has changed, and that will become important in a few months to a year.
I will add this chart to the historic analysis and update that over the weekend.
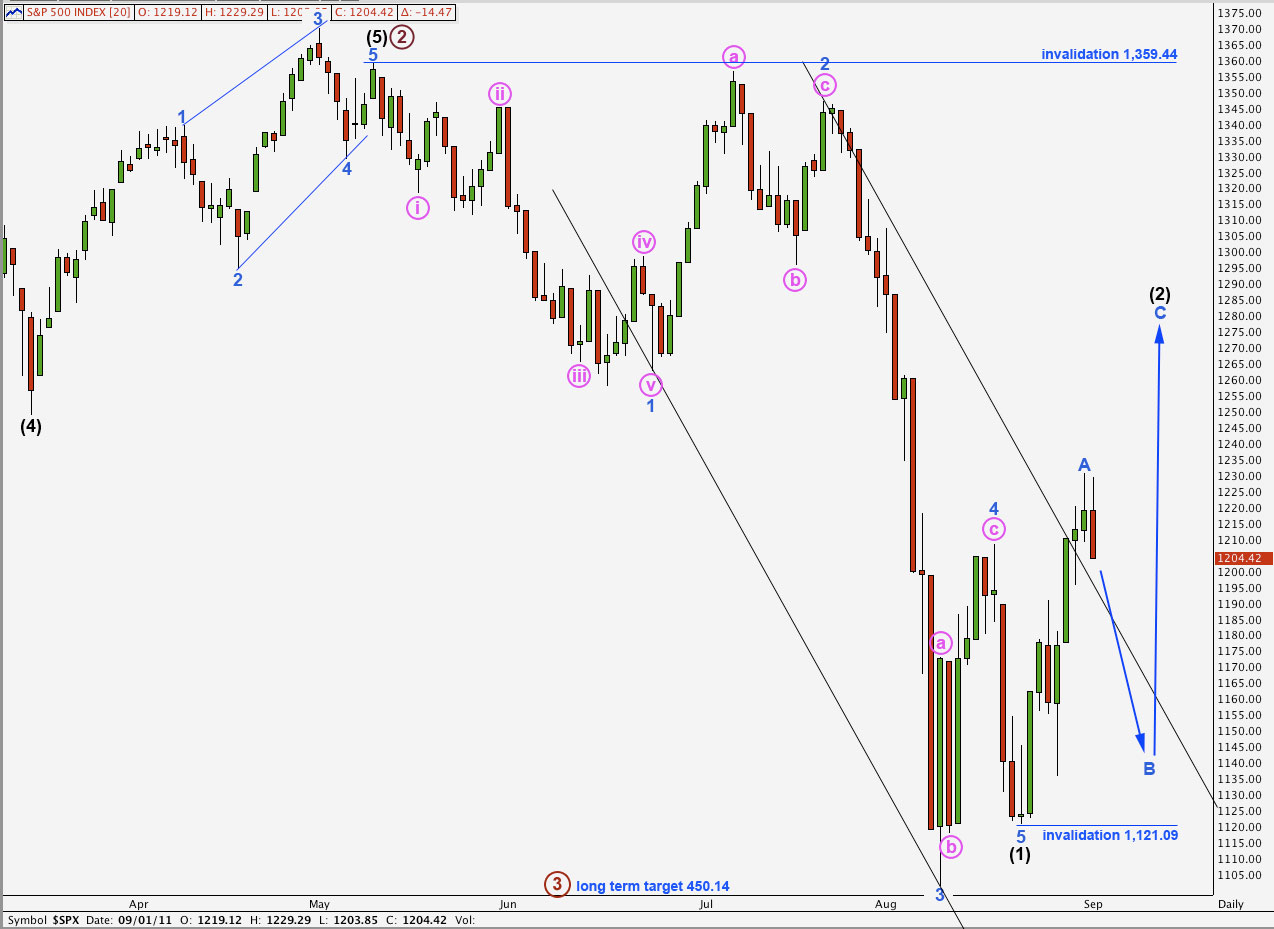
Everything on the daily chart has been moved down one degree and now this wave count has a much more satisfactory look in terms of wave durations for this degree of labeling.
As expected from yesterday’s main hourly wave count we have seen further downwards movement from the S&P 500 during Thursday’s session.
Wave (2) black looks like it is unfolding as a simple zigzag. If it is a double or combination then the first structure will be a zigzag.
When we know where wave B blue has ended we may calculate a target upwards for wave (2) black to end. It would be premature to do this today.
Wave B blue may not move beyond the start of wave A blue. This wave count is invalidated with movement below 1,121.09.
Main Hourly Wave Count.
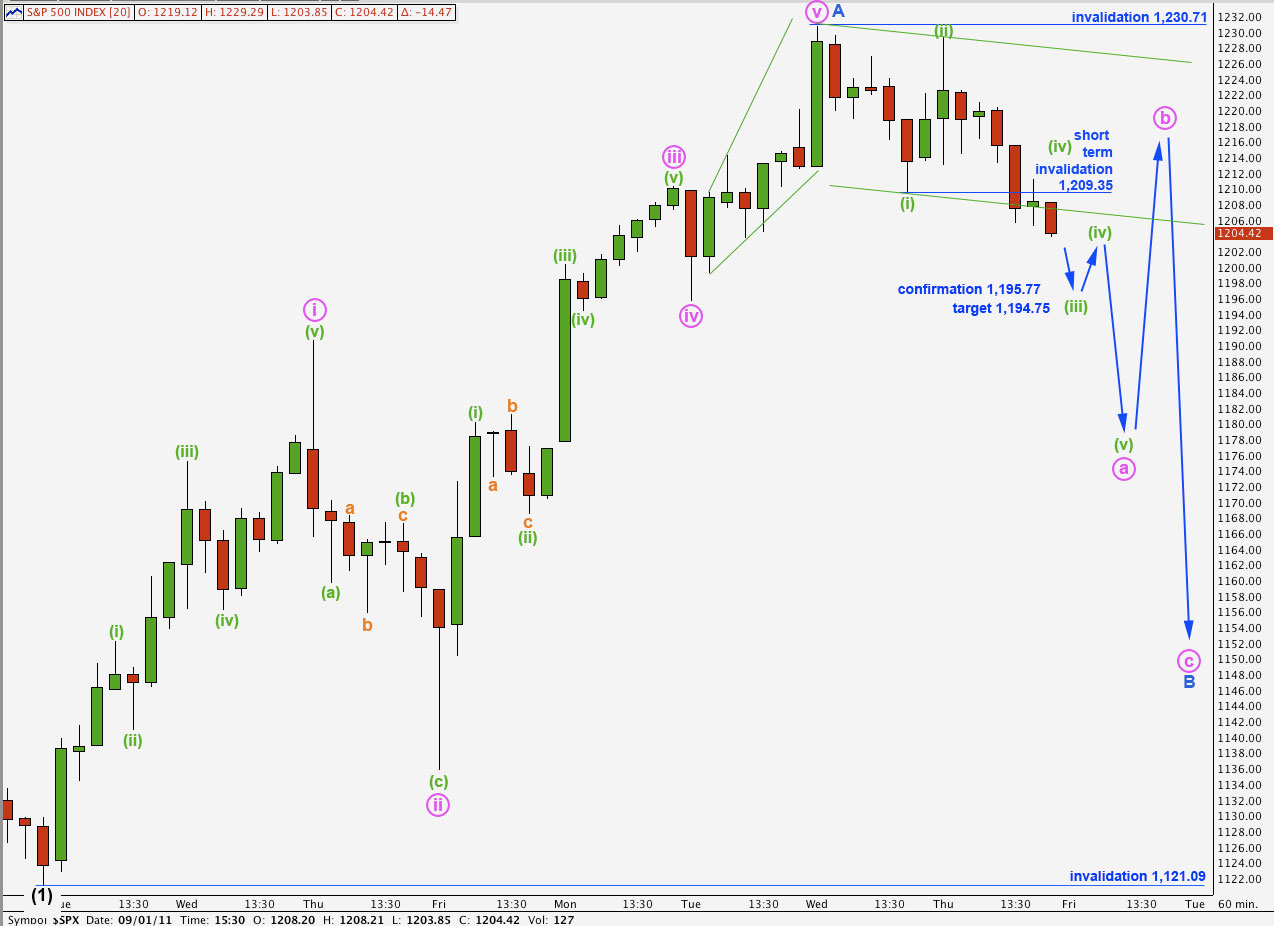
This wave count expected further downwards movement yesterday.
We may draw a base channel about wave (i) green. This channel has been breached to the downside, and this may be some indication that downwards movement is a small third wave (although I have noticed that C waves also often breach these channels).
When wave (iii) green has completed we should redraw the channel using Elliott’s technique. Draw first a trend line from the low of (i) green to wherever wave (iii) green has ended, place a parallel copy on the high of (ii) green and expect wave (iv) green to be contained within the parallel channel.
Price movement below 1,195.77 will invalidate our alternate hourly wave count and confirm this main hourly wave count.
At 1,194.75 wave (iii) green would reach 1.618 the length of wave (i) green.
Thereafter, wave (iv) green should not move into wave (i) green price territory. This wave count would at that stage be invalidated with movement above 1,209.35. If it were invalidated by upwards movement then we would expect that wave a pink is unfolding as a leading diagonal and the invalidation point would then move to the end of wave (ii) green at 1,229.29.
When we know the length of wave (iii) green and have the end of wave (iv) green then we may calculate a target for wave (v) green to end wave a pink.
We should expect overall a continuation of downwards movement tomorrow with choppy overlapping movement for the next few days.
Alternate Hourly Wave Count.
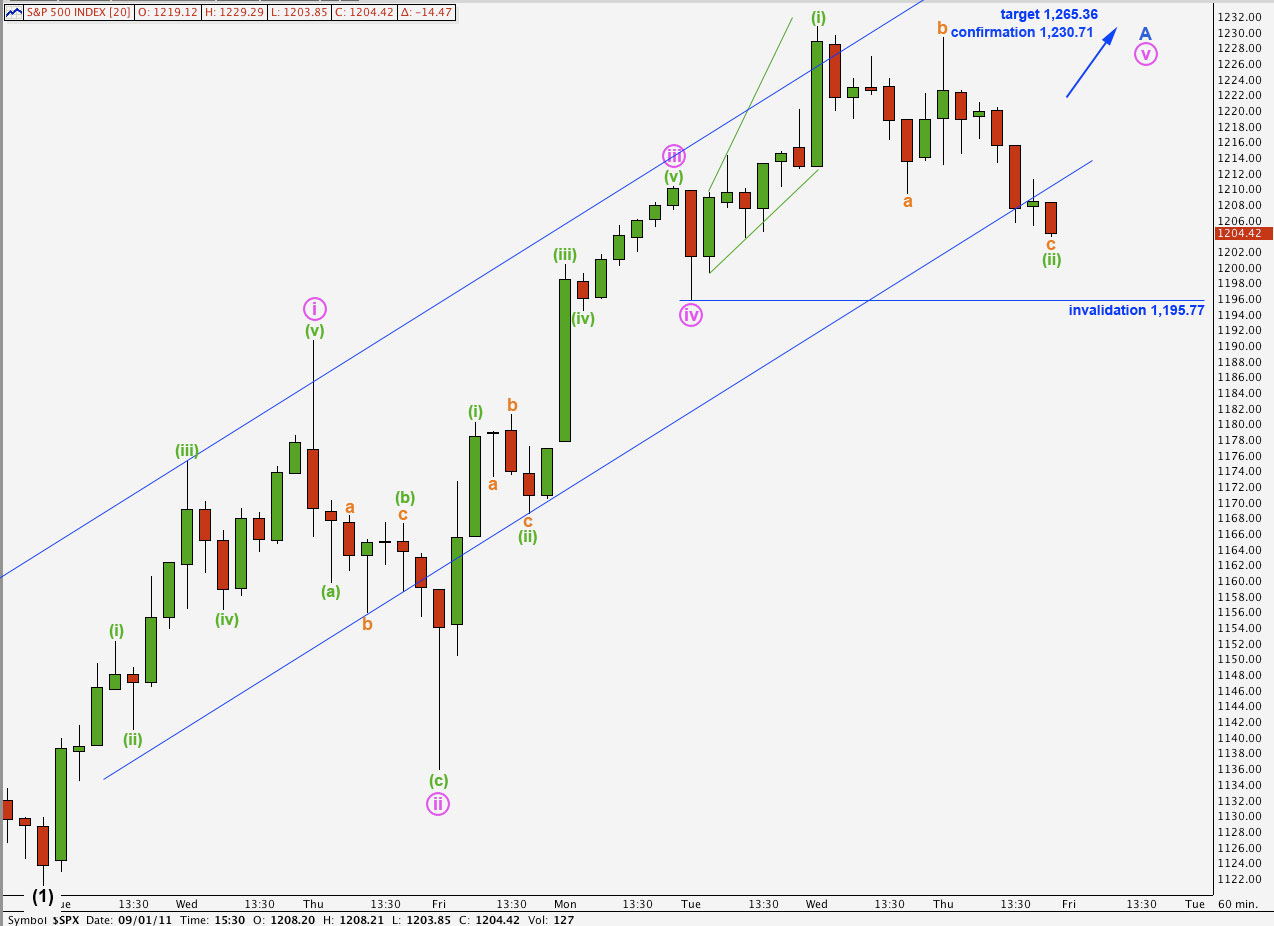
While price remains above 1,195.77 this alternate wave count will remain valid.
Any further movement downwards of wave ii pink may not move beyond the start of wave i pink. This wave count is invalidated with movement below 1,195.77.
At 1,265.36 wave 5 blue would reach equality in length with wave 1 blue. If price moves above 1,230.71 confirming this wave count then we should expect further upwards movement and may use this target.