
Elliott Wave chart analysis for the S&P 500 for 31st August, 2011. Please click on the charts below to enlarge.
The S&P 500 moved higher yesterday to reach 6.53 points above our target. The diagonal structure for the final fifth wave upwards was expanding and not contracting, as analysed yesterday.
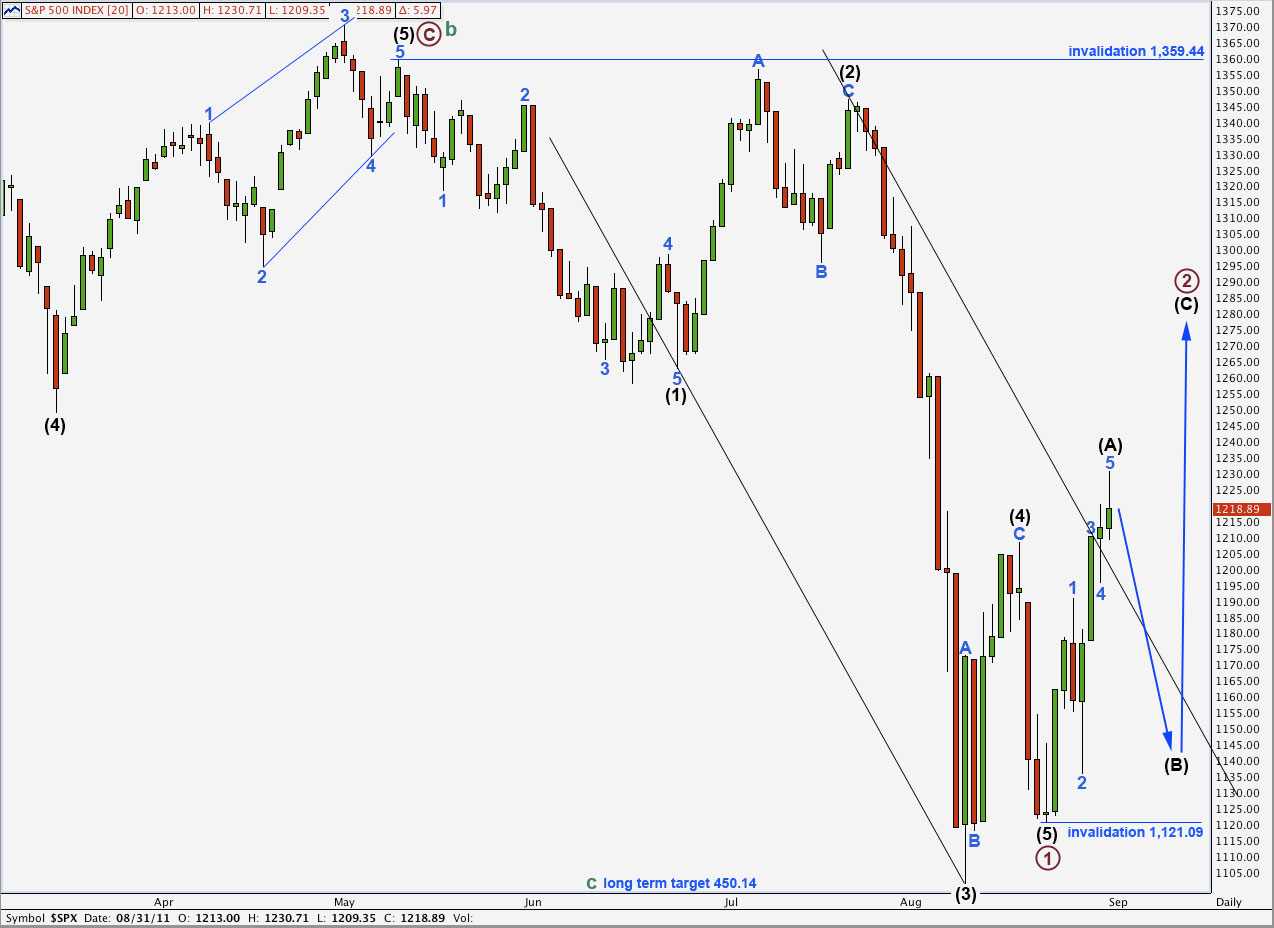
It is possible that wave (A) black within primary wave 2 is now complete. Wave (B) black should last at least a couple of days, and may last over a week. It should take price lower in choppy corrective overlapping movements. Wave (B) black may not move beyond the start of wave (A) black. This wave count is invalidated with movement below 1,121.09.
Primary wave 2 may not move beyond the start of primary wave 1. This wave count is invalidated with movement above 1,359.44.
Main Hourly Wave Count.
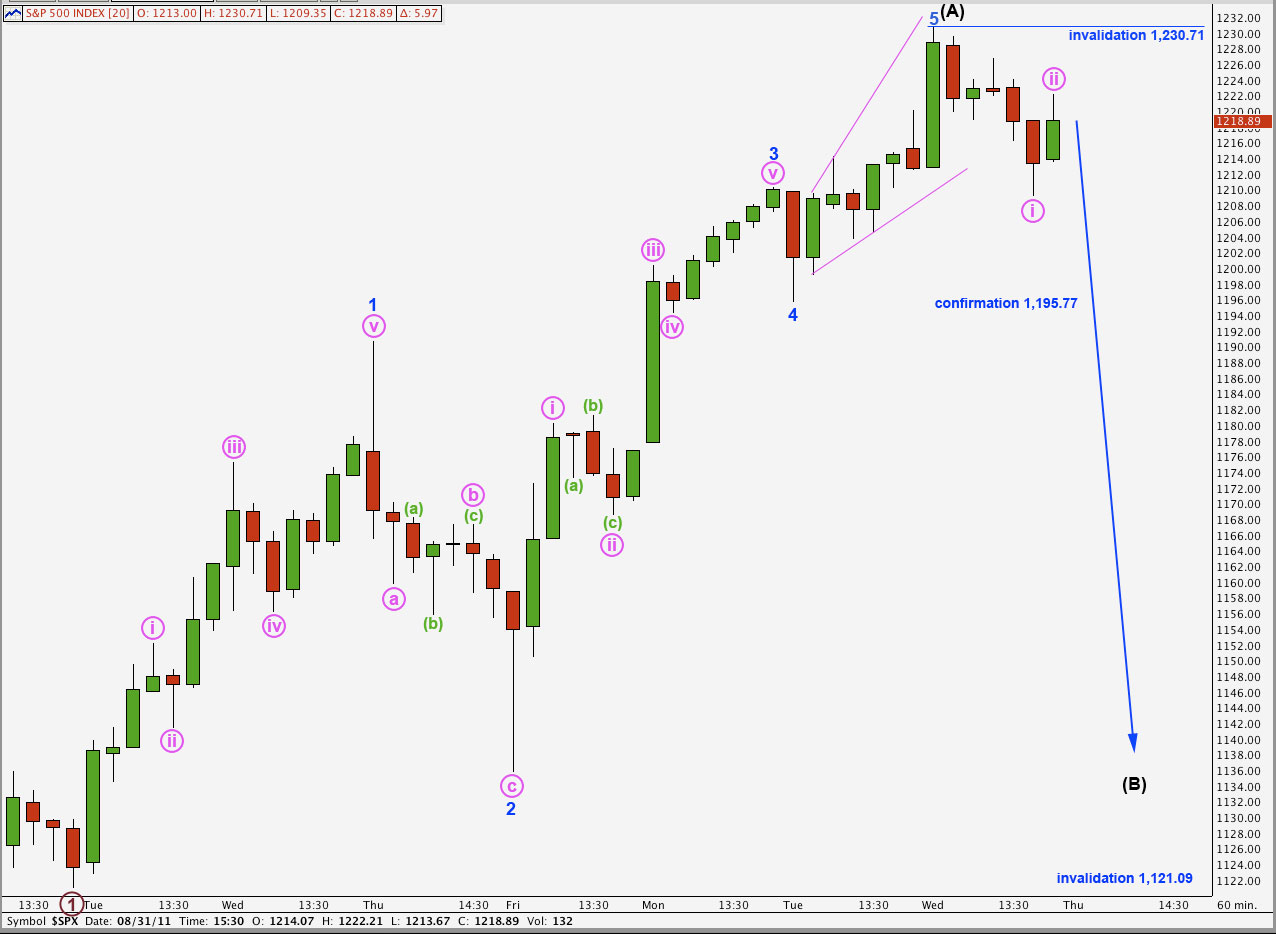
This first hourly wave count seems more likely. Wave (A) black is most likely complete. Wave 3 blue within it is 4.78 points longer than equality with wave 1 blue, and there is no Fibonacci ratio between wave 5 blue and either of 3 or 1.
Wave 5 blue is a complete ending expanding diagonal, and all subwaves may be seen as zigzags on the 5 minute chart. Because the ends of waves i and ii pink are not seen correctly on the hourly chart, I have not put labels for them here.
Wave i pink within wave (B) black downwards looks like a five wave impulse on the 5 minute chart.
Within wave (B) black at this stage wave ii pink may not move beyond the start of wave i pink. This wave count is invalidated with movement above 1,230.71.
Alternate Hourly Wave Count.
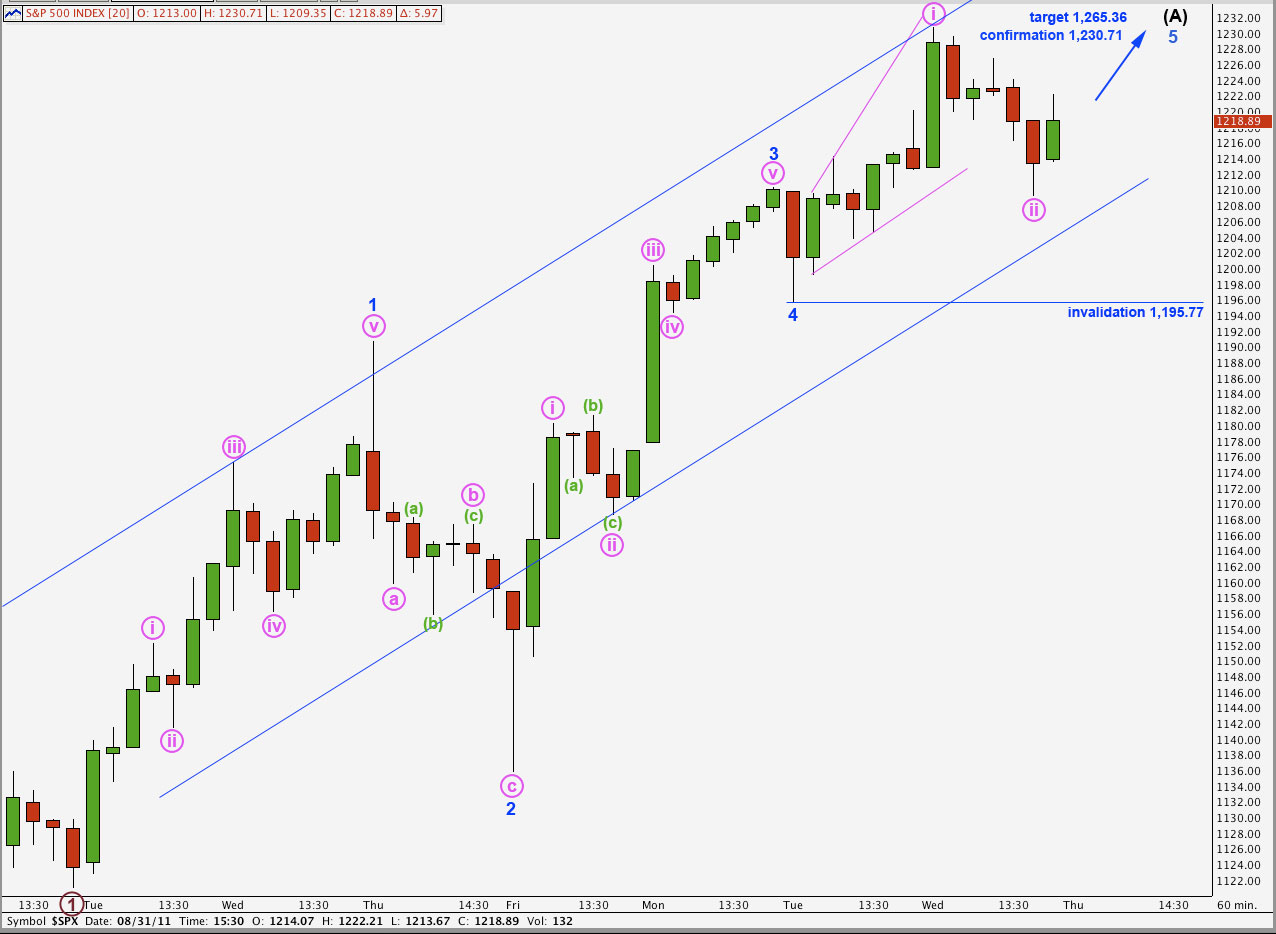
Alternately, the expanding diagonal may have been a leading diagonal for wave i pink within wave 5 blue. We may simply move the degree of labeling within it down one degree.
This wave count does not fit as well as the main hourly wave count. I think it is easier to see downwards movement as a five wave impulse on the 5 minute chart. However, on the hourly chart it has a three wave look to it. It may have been a zigzag or more likely a double zigzag.
Any further movement downwards of wave ii pink may not move beyond the start of wave i pink. This wave count is invalidated with movement below 1,195.77.
At 1,265.36 wave 5 blue would reach equality in length with wave 1 blue. If price moves above 1,230.71 confirming this wave count then we should expect further upwards movement and may use this target.