
Elliott Wave chart analysis for the S&P 500 for 30th August, 2011. Please click on the charts below to enlarge.
The S&P 500 moved overall higher as expected after yesterday’s analysis. However, the targets for wave 3 blue were not met and wave 4 blue began at the beginning of Tuesday’s session.
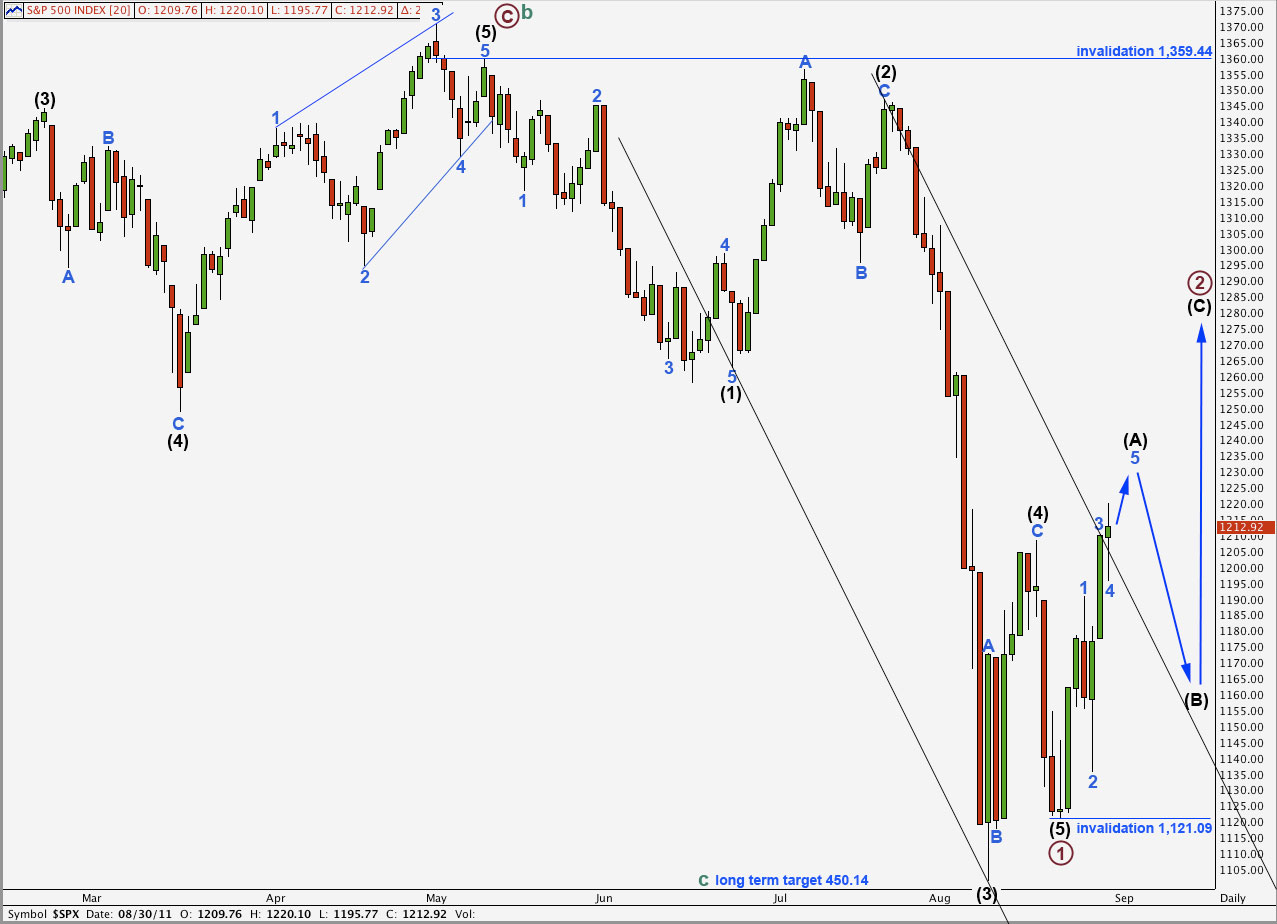
This second wave correction looks like it is unfolding as a zigzag. It may also be a double zigzag or a combination, but the first structure in a possible double will be a zigzag.
Wave (A) black within the zigzag is incomplete and it may end tomorrow.
Wave (B) black may not move beyond the start of wave (A) black. This wave count is invalidated in the short term with movement below 1,121.09.
Primary wave 2 may not move beyond the start of primary wave 1. This wave count is invalidated with movement above 1,359.44.
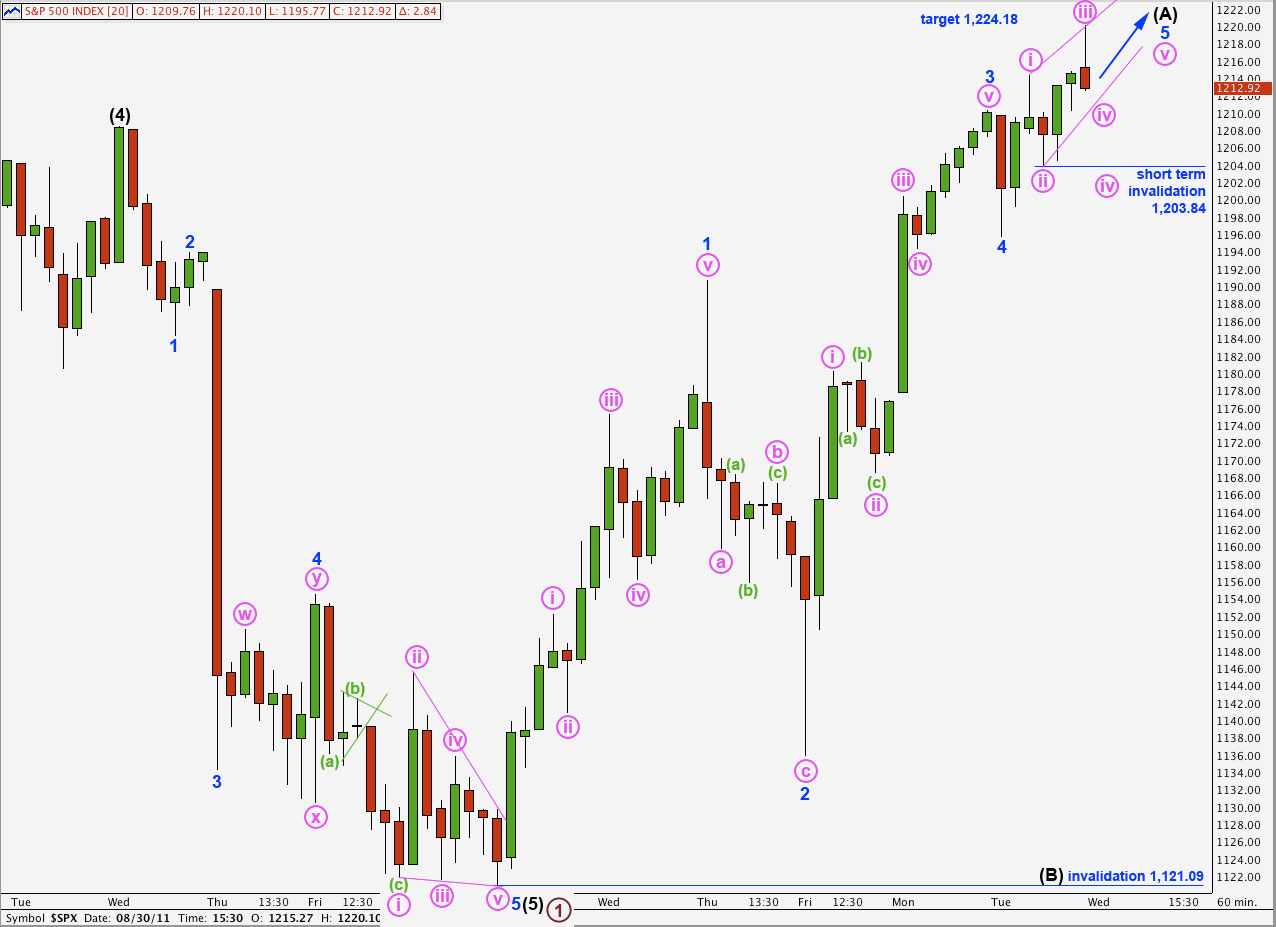
Wave 3 blue was over at the end of Monday’s session and did not move higher towards our targets. Wave 4 blue was a shallow zigzag, providing some alternation in depth of correction with wave 2 blue which was deep.
Wave 3 blue was 4.78 points longer than equality with wave 5 blue. At 1,224.18 wave 5 blue will reach 0.382 the length of wave 3 blue.
Wave 5 blue looks like it is completing as an ending contracting diagonal. Subwaves i and iii pink look most easily like zigzags on the 5 minute chart.
Wave iv pink should not be longer than equality with wave ii pink. It has its maximum limit at 1,209.66. Wave iv pink may not move beyond the end of wave ii pink below 1,203.84.
Wave v pink to end the diagonal may not be longer than equality with wave iii pink at 16.26 points.
We may see a trend change tomorrow after the end of this diagonal. Wave (B) black should take price lower for at least a couple of days. It may not move beyond the start of wave (A) black. This wave count is invalidated with movement below 1,121.09.