
Elliott Wave chart analysis for the S&P 500 for 29th August, 2011. Please click on the charts below to enlarge.
All our wave counts for the end of week analysis expected upwards movement and this is what we have seen.
The main wave count published first was invalidated with price movement above 1,208.47. At this stage the later published alternate wave count was confirmed.
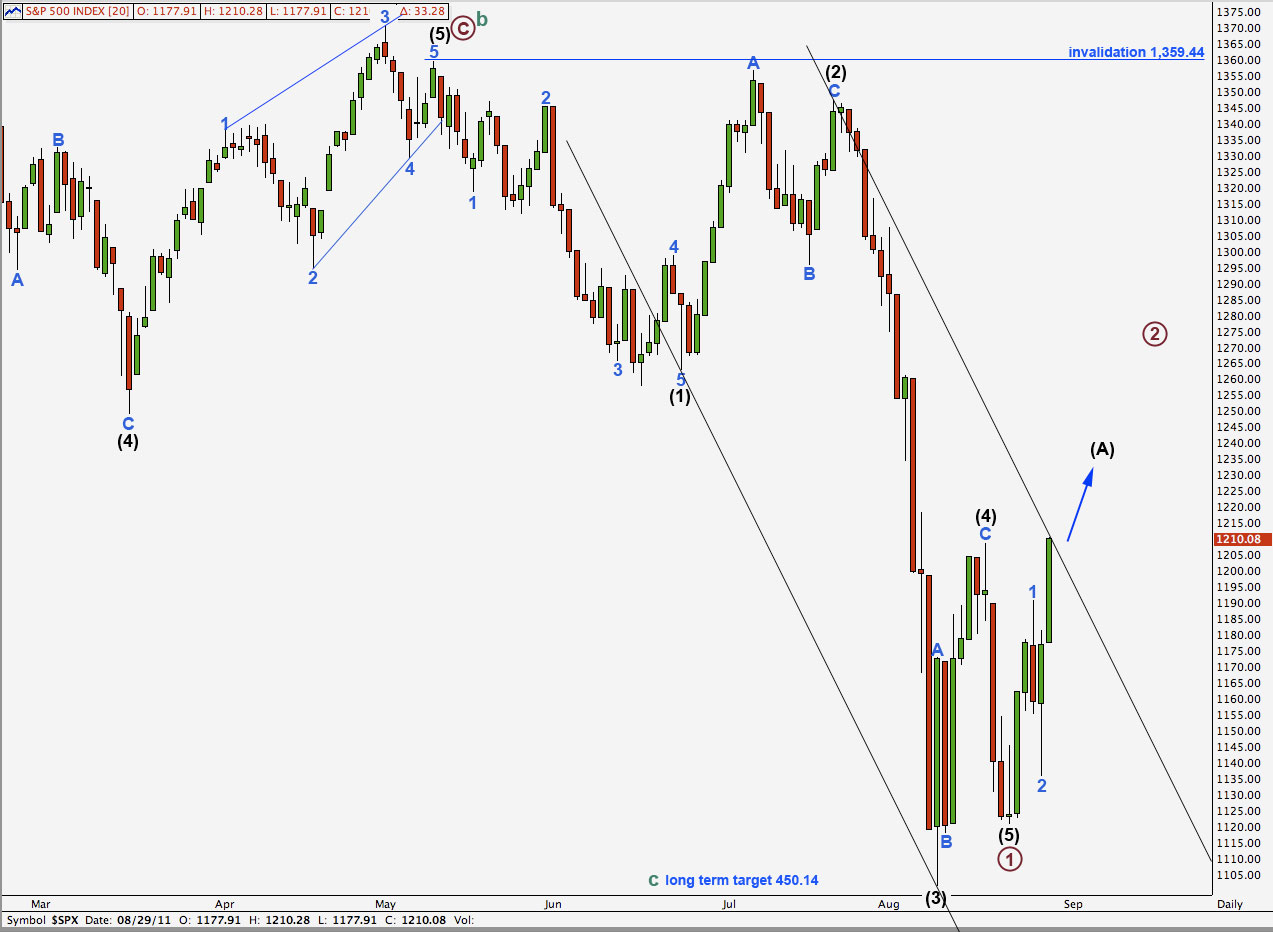
It is not possible now to see an alternate wave count which allows for wave (4) black to be continuing. It must be over and the following fifth wave was truncated. Wave (3) black is just 2.12 points longer than 2.618 the length of wave (1) black, and there is no Fibonacci ratio between waves (5) and either of (1) or (3) black.
I am considering switching back to what was my original wave count: that this downwards movement is primary wave 3 within a cycle wave c of an expanded flat correction. I will chart this and publish it within the next couple of days. This would move the entire wave count all down one degree of labeling. We would be looking at entering intermediate wave 2 rather than primary wave 2. We would expect this to last at least a week if not several weeks.
Either way, the S&P 500 has recently begun a second wave correction. We may see a deep correction, but if this is within a third wave it may be briefer and shallower than normal.
Primary wave 2 may not move beyond the start of primary wave 1. This wave count is invalidated with movement above 1,359.44.
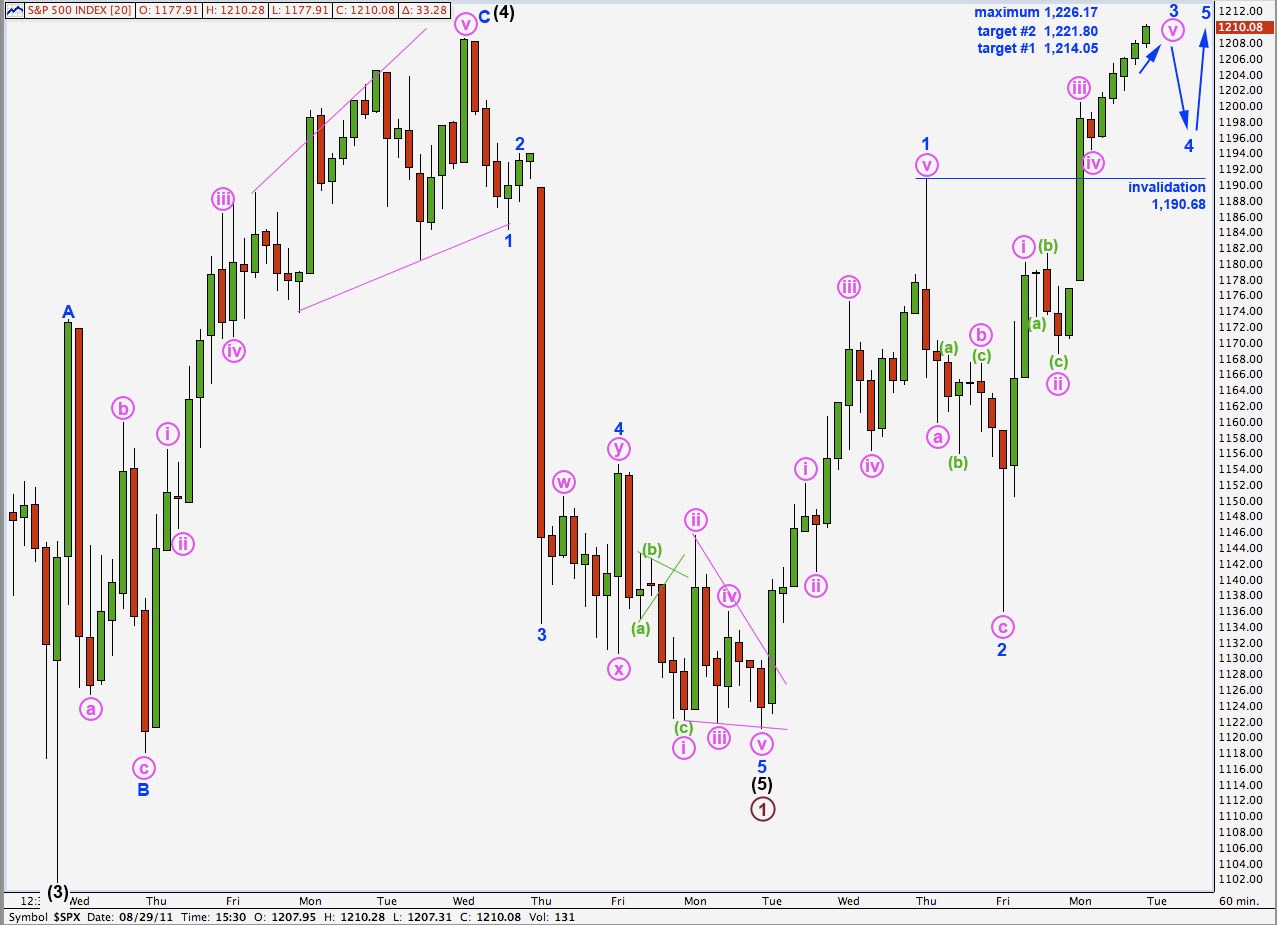
Upwards movement for Monday has a typical third wave look and created a new extreme reading on MACD. Wave iii pink is most likely over, and it was shorter than wave i pink. There is no Fibonacci ratio between the two. This makes it more than likely we shall see a Fibonacci ratio between wave v pink and either of i or iii.
At 1,214.05 wave v pink would reach 0.618 the length of wave iii pink. This is our first more likely target.
At 1,221.80 wave v pink would reach 0.618 the length of wave i pink. This is our second slightly less likely target.
Wave v pink may not be longer than equality with wave iii pink as wave iii may not be the shortest wave. This maximum level is at 1,226.17.
When wave 3 blue is complete then we shall expect a fourth wave correction which may not move back down into wave 1 price territory. The invalidation point today is at 1,190.68.
Ratios within wave (5) black are: wave 3 blue is 3.48 points short of 2.618 the length of wave 1 blue and wave 5 blue is 3.41 points short of 0.618 the length of wave 3 blue.
This invalidation point assumes that wave (A) black will subdivide into a five wave structure and that primary wave 2 would be a zigzag. This is the most likely structure for it.
If the invalidation point is breached then we may expect use the alternate hourly wave count below.
Alternate Hourly Wave Count.
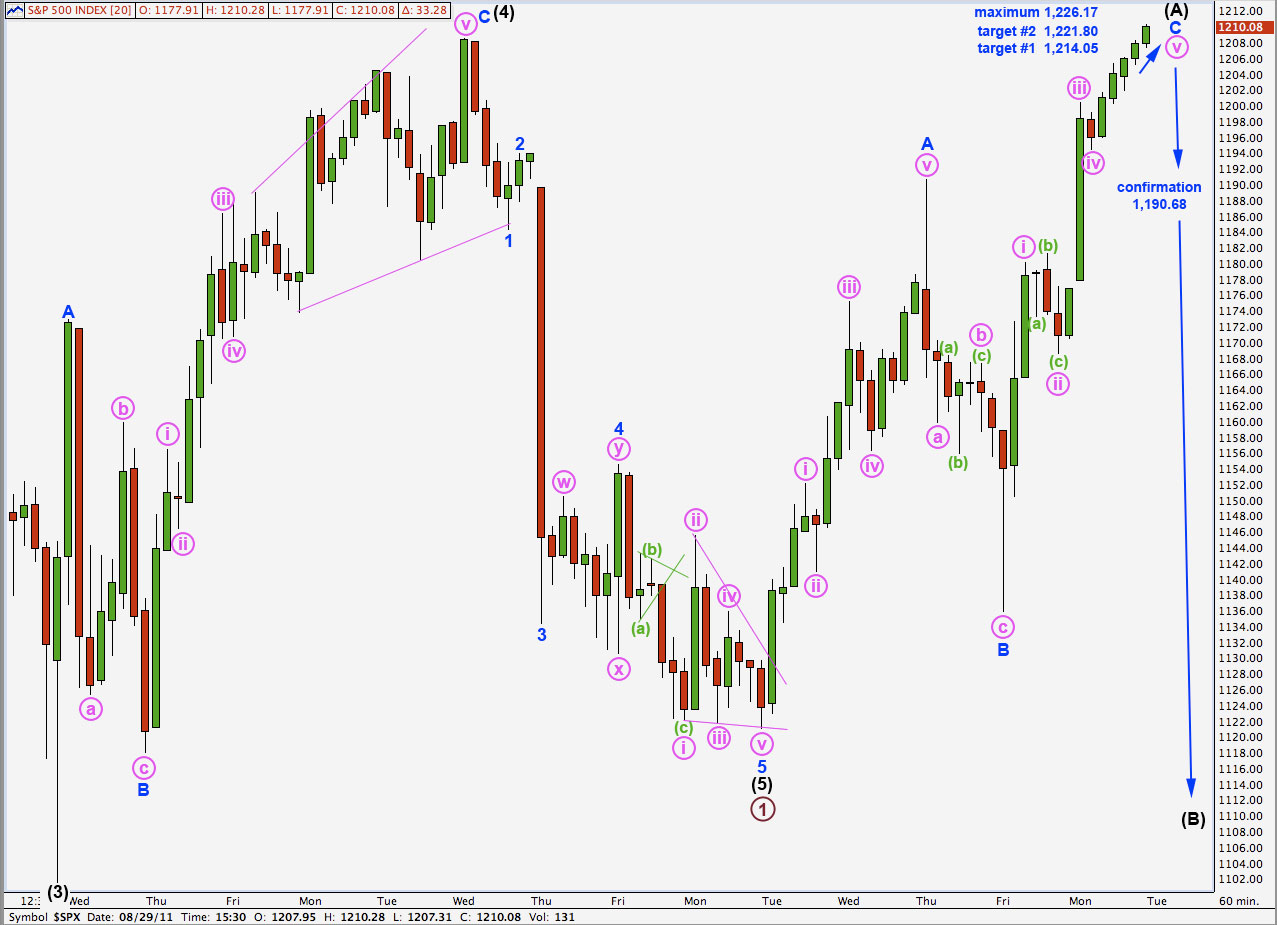
This wave count is exactly the same as the first hourly wave count, except that instead of blue 1-2-3 upwards this wave count sees blue A-B-C upwards almost complete.
This wave count would be confirmed with movement below 1,190.68.
At that stage we would know that wave (A) black is unfolding as a three wave flat correction.
Wave (B) black may make a new price extreme beyond the start of wave (A) black and so this wave count has no lower invalidation point.