
Elliott Wave chart analysis for the S&P 500 for 25th August, 2011. Please click on the charts below to enlarge.
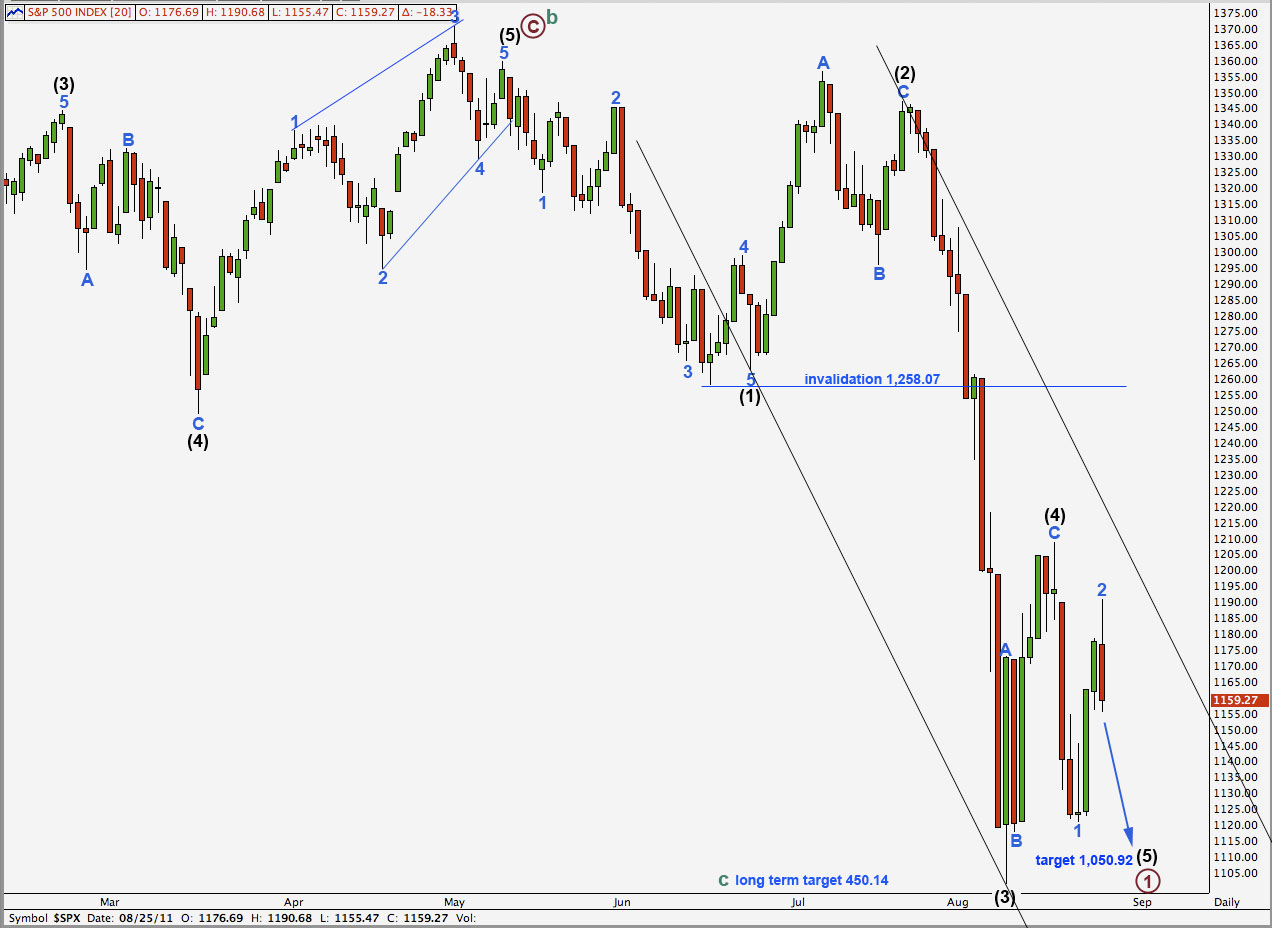
I have invested more time looking at cycle wave a downwards. Corrections within cycle wave a equivalent to this wave (4) black were relatively brief and it seems most likely that wave (4) black was over, as per one of our hourly wave counts.
Today we have only three wave counts on the hourly chart and I have ordered them into what I judge to be from highest to lowest probability.
They all expect downwards movement to continue for Friday and there is no divergence in our expectations for price direction tomorrow.
The first wave count sees wave (4) black as complete, as now labeled on the daily chart. The second sees wave (4) black as an incomplete flat which requires downwards movement to at least 1,112.23. The third least likely wave count sees wave (4) black as an incomplete triangle which is invalidated with price movement below 1,121.09.
If wave (4) black is complete then a possible target for wave (5) black is about 1,050.92 where it would reach 0.618 the length of wave (3) black (equality with wave (1) black would see wave (5) truncated). However, because there is a close Fibonacci ratio between wave (3) black and wave (1) black, wave (3) black is just 2.12 points longer than 2.618 the length of wave (1) black, and it is less likely that we shall see a ratio between wave (5) black and either of (1) or (3). A more reliable way to find a target for wave (5) black to end is to use the ratios at blue degree within it. We cannot do this until blue wave 4 is over.
Any further upwards movement for wave (4) black may not move into wave (1) black price territory. This wave count is invalidated with movement above 1,258.07.
One of the wave counts from yesterday was invalidated when price did not reach 1,196.15.
First Hourly Wave Count.
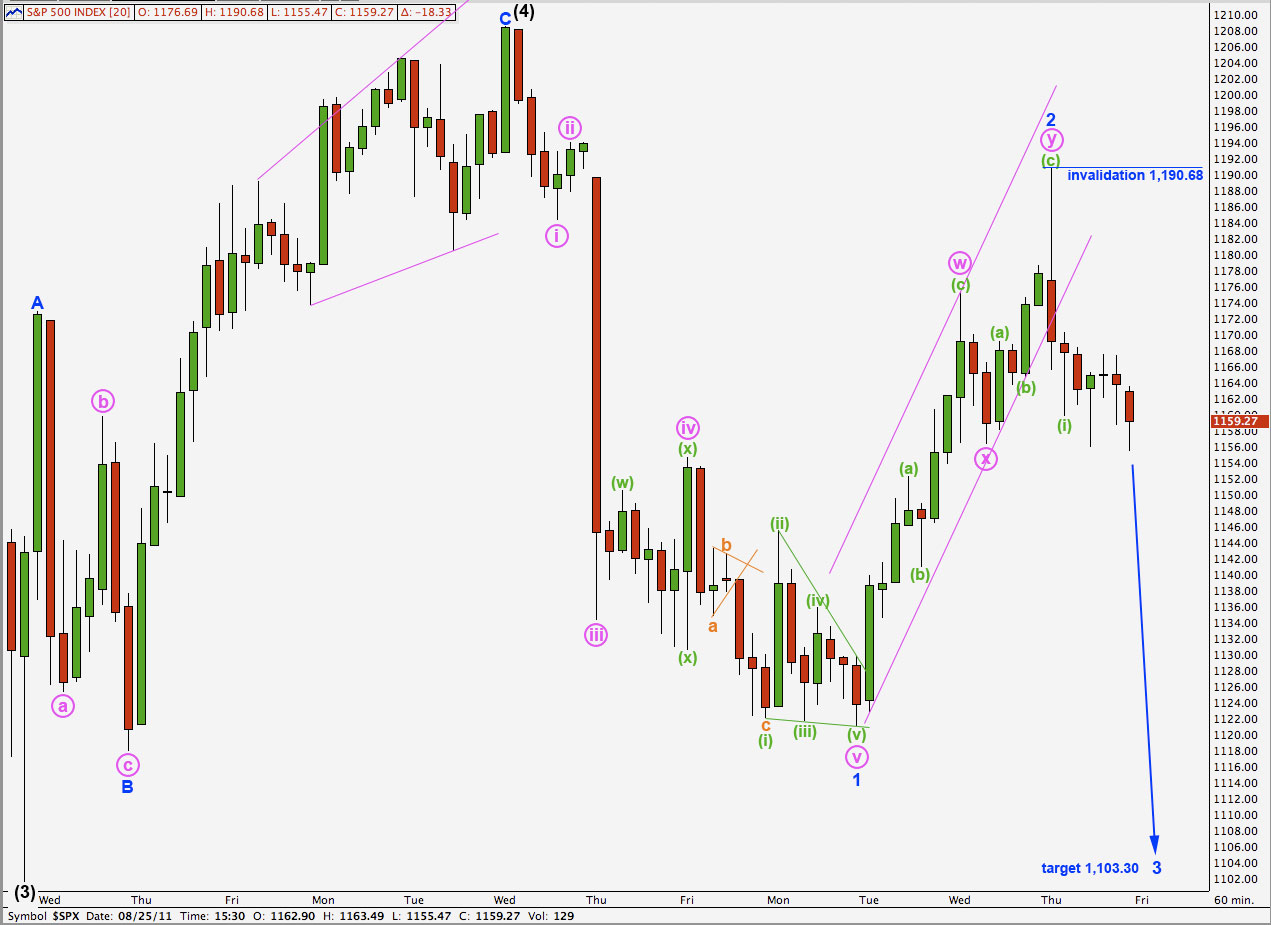
This wave count expects downwards movement for the next few days to exhibit strong momentum as it is a third wave.
Wave 2 blue is a complete double zigzag structure and the small parallel channel containing it has been comfortably breached by downwards movement. We may take this as confirmation that wave 2 is over and wave 3 is underway.
Wave 2 blue was a deep 80% correction of wave 1 blue. Normally we would then expect wave 3 to be about 1.618 the length of wave 1, but this gives a target which is lower than the target calculated for wave (5) black to end.
Wave 3 blue would reach equality with wave 1 blue at 1,103.30. When waves i, iii and iv pink are complete we may refine this target by using ratios at pink degree to calculate an end to this third wave.
On the 5 minute chart wave (i) green downwards is a perfect impulse. The structure of wave (ii) green may not be complete (unless it was a running flat) and so I will not label it complete yet. It may move higher and the invalidation point must be at 1,190.68 because wave (ii) green may not move beyond the start of wave (i) green.
Second Hourly Wave Count.
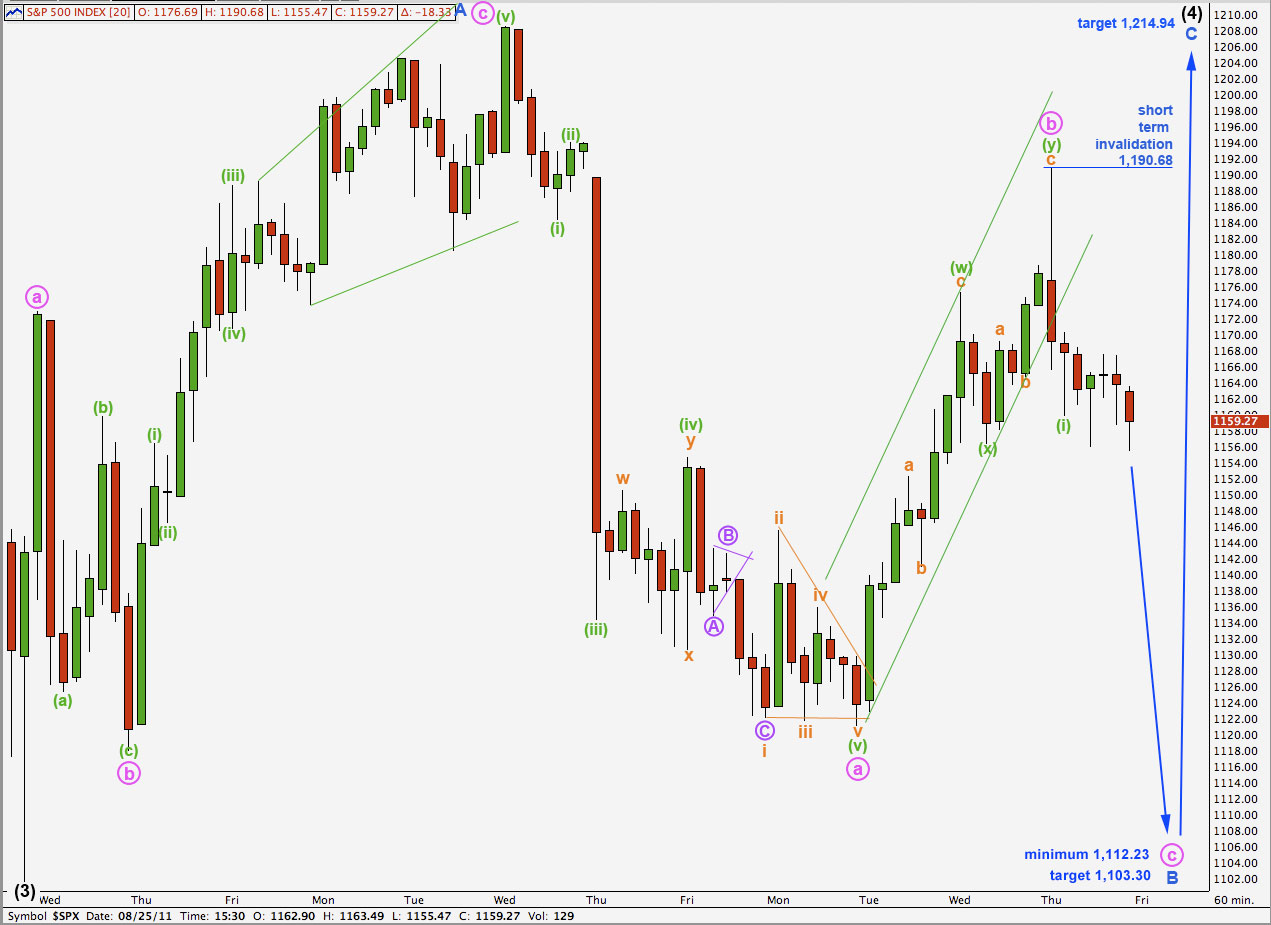
This was our first hourly wave count yesterday.
This wave count expected a trend change during Thursday’s session, which we did see, but the targets were not useful as price ended between them.
Because wave A blue subdivided into a three wave B blue must reach 90% the length of wave A blue. This wave count requires movement to at least 1,112.23.
The target for downwards movement to (temporarily) end is the same as for the first wave count. At 1,103.30 wave c pink would reach equality in length with wave a pink.
Within wave c pink wave (ii) green may not move beyond the start of wave (i) green. This wave count is invalidated with movement above 1,190.68.
Third Hourly Wave Count.
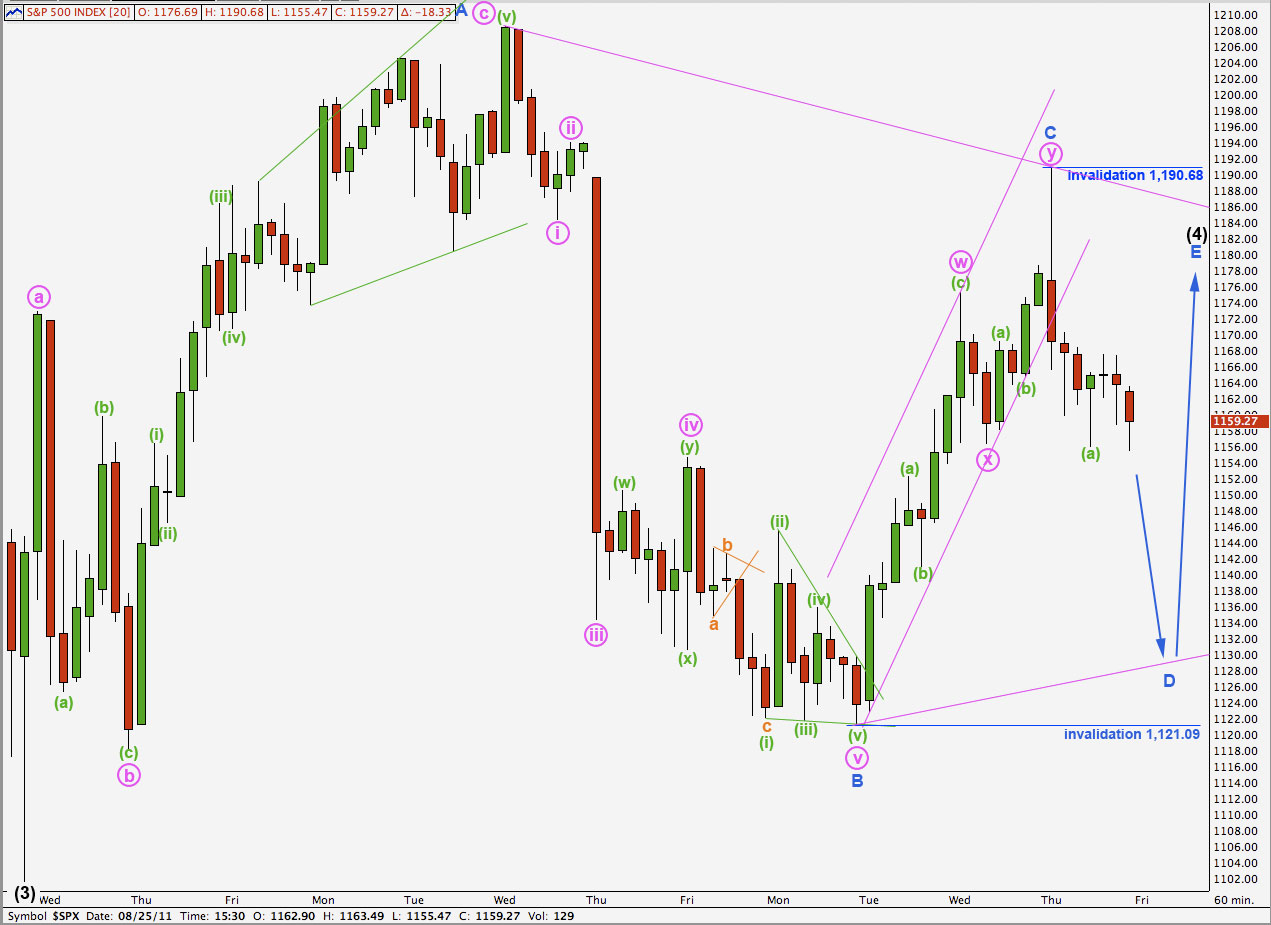
This remains the least likely of our hourly wave counts, but it is a technical possibility and we must consider it.
Wave (4) black may be continuing as a contracting or barrier triangle. We can eliminate the possibility of a rare expanding triangle because wave C blue has not moved beyond the end of wave A blue.
Movement below 1,121.09 would invalidate this wave count as wave D may not move beyond the end of wave B blue.
For a barrier triangle wave D may end essentially at the same level of wave B blue which in practice means it may end very slightly below this point, but not by very much at all.
Wave B blue is a five wave impulse (which does not break any rules but would be highly unusual) and so all the remaining subwaves must be zigzags or zigzag combinations, including wave D blue downwards.
Thereafter, wave E blue may not move beyond the end of wave C blue at 1,190.68. Movement above this point, even by a fraction of a point, would invalidate this wave count.
I am expecting it is most likely that this wave count would be invalidated by downwards movement either tomorrow or early next week.