
Elliott Wave chart analysis for the S&P 500 for 24th August, 2011. Please click on the charts below to enlarge.
The S&P 500 continued to move higher as expected after last analysis. All our three hourly wave counts from last analysis remain valid.
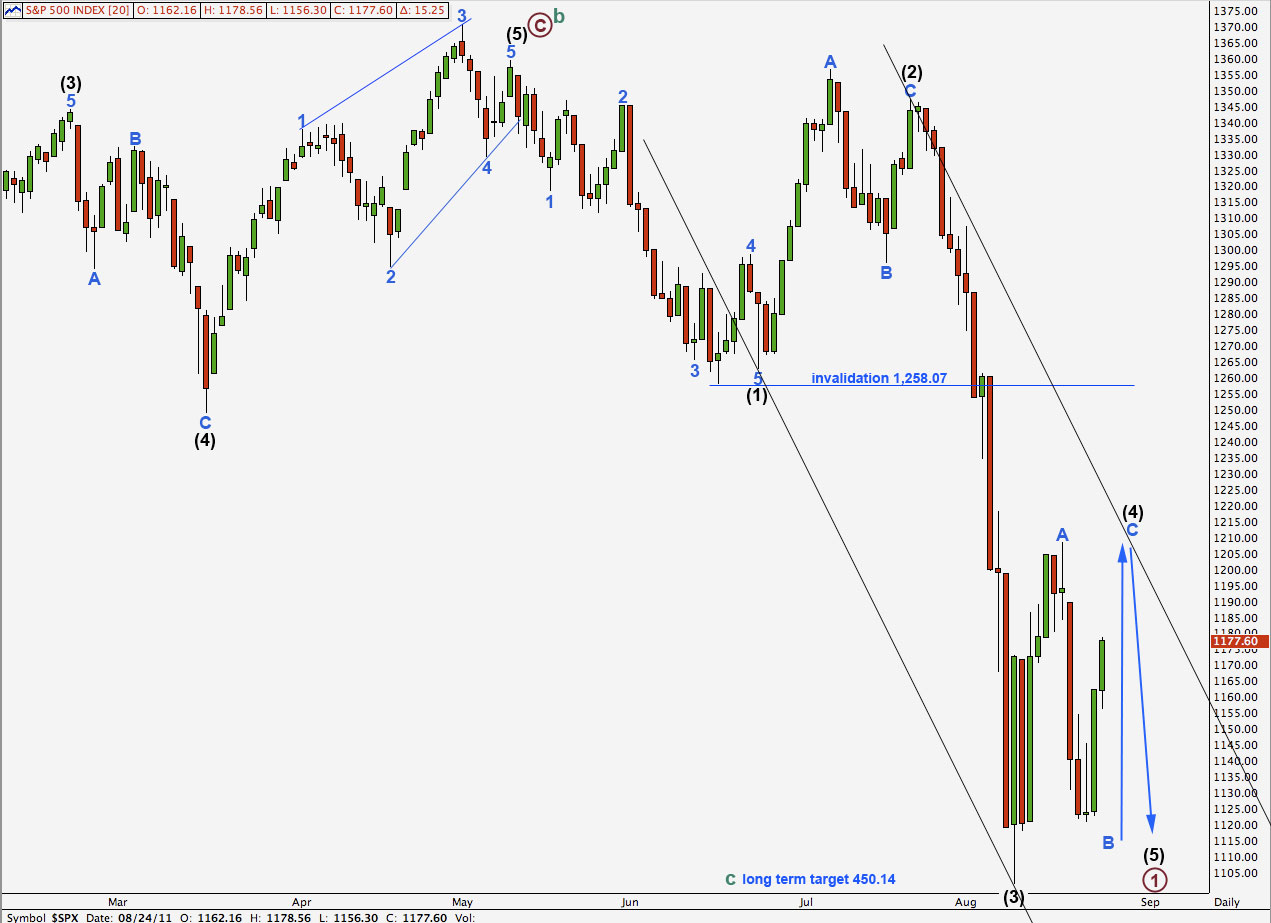
I have taken a look at cycle wave a, the credit crunch wave, and the first fourth wave at intermediate degree within that lasted only 8 days. Therefore, I am including again the wave count which sees intermediate wave (4) as over. This may be important because if it is correct then we should see a third wave down begin in another one or so sessions.
In the very short term, there is no divergence in our expectations for the next day or two between the four hourly wave counts I present today.
Wave (4) black may not move into wave (1) black price territory. This wave count is invalidated with movement above 1,258.07.
When wave (4) black is complete the next movement should be a fifth wave downwards to complete primary wave 1 of cycle wave c.
First Hourly Wave Count.
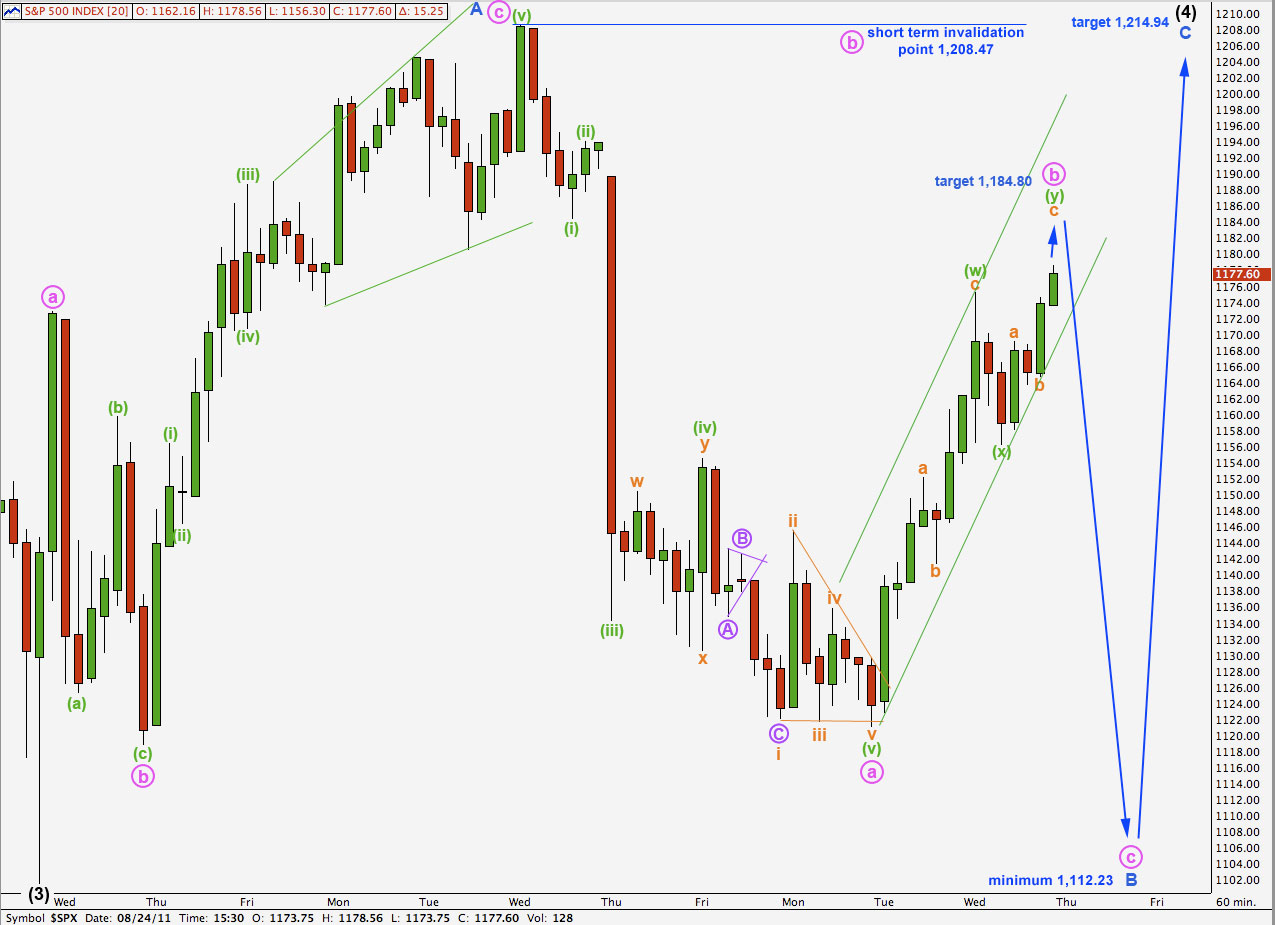
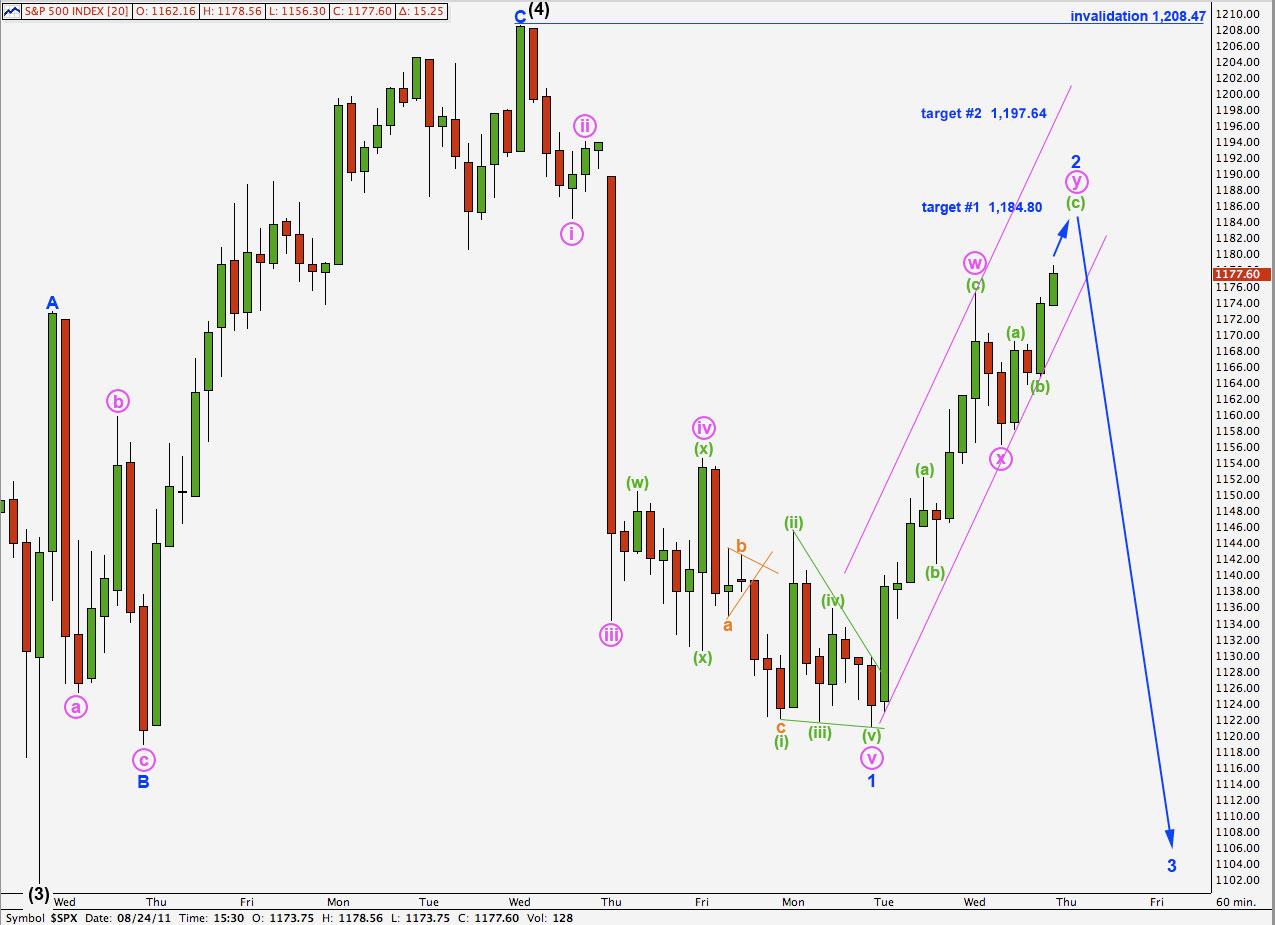
This first hourly wave count sees wave B blue within wave (4) black as completing an exaggerated zigzag.
Wave b pink is extending higher as a double zigzag. Within wave (w) green wave c orange was just 2.69 points longer than equality with wave a orange.
At 1,184.80 wave c orange within the second zigzag of wave (y) green would reach 1.618 the length of wave a orange.
We may draw a best fit parallel channel about wave b pink. When we see a full hourly candlestick below the channel then we may expect wave b is complete and the next wave down should be underway.
Because wave A blue subdivided into a three then (4) black may be a flat correction. Wave B blue must reach 90% the length of wave A blue at 1,112.23.
Within wave B blue wave b pink may not move beyond the start of wave a pink. This wave count is invalidated with movement above 1,208.47 in the short term.
Second Hourly Wave Count.
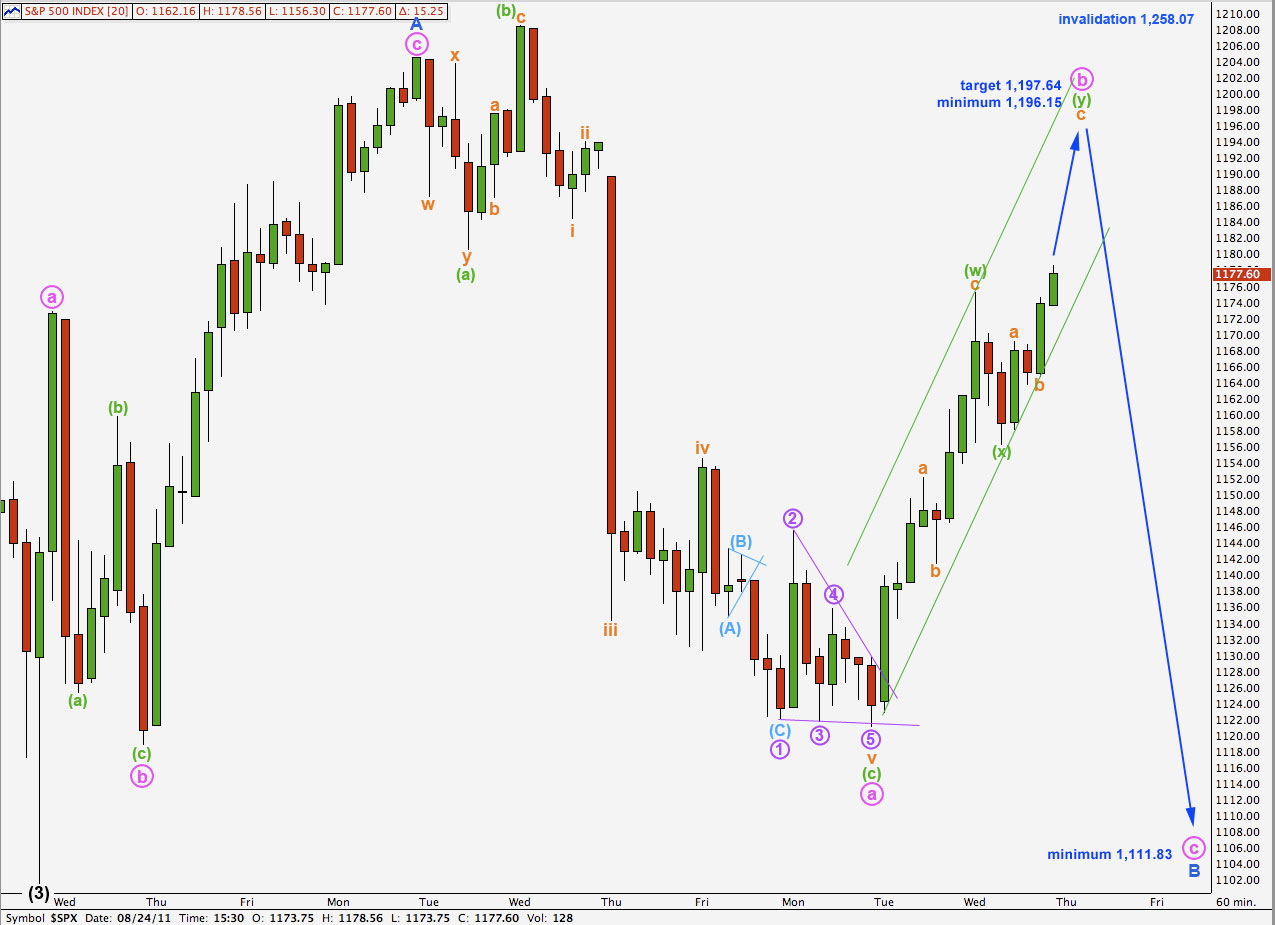
Because wave A blue was a clear three wave structure wave (4) black is here also seen as a flat correction. The low at 1,121.09 is less than 90% the length of wave A blue. Wave B must reach at least 90% the length of wave A blue, and it is likely that it is incomplete.
Because wave a pink was a three wave structure then wave b pink must reach 90% its length. This would be achieved at 1,196.15. If price reaches up to this point or above in the next one to few days then this will be a preferred wave count.
The structure for wave b pink as a double zigzag is here the same as the first hourly wave count. At 1,197.64 wave c orange would reach 2.618 the length of wave a orange within the second zigzag wave (y) green of the double zigzag for b pink.
Because wave a pink was a three wave expanded flat wave b pink may make a new price extreme beyond the start of wave a, and there is no upper invalidation point which is different from the daily chart.
Third Hourly Wave Count.
This wave count has the lowest probability of the four counts today. However, it is a possibility we should keep in mind.
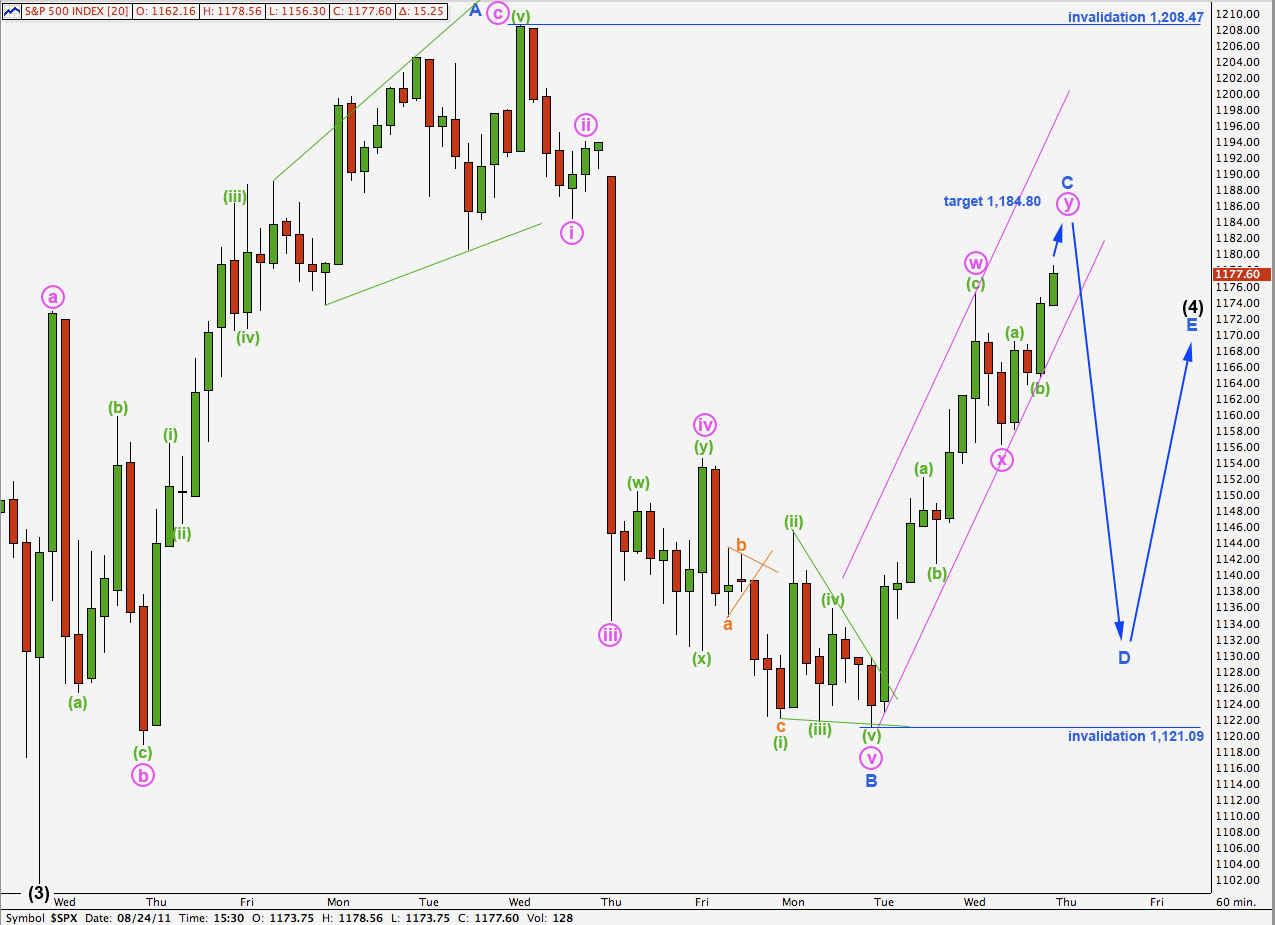
Wave (4) black may be completing a triangle. We may expect one of the subwaves of a triangle to be longer lasting and more complicated than the others, and wave C blue as a double zigzag performs this function.
For a contracting triangle wave C may not move beyond the start of wave A. This wave count is invalidated with movement above 1,208.47.
Wave D may not move beyond the end of wave B. This wave count is invalidated with movement below 1,121.09.
Fourth Hourly Wave Count.
Within cycle wave a the first intermediate degree fourth wave lasted a Fibonacci 8 days (and ended perfectly where Elliott’s trend channel showed it should). With today’s fourth hourly chart, if wave (4) black was over at 1,208.47 it lasted 7 days. This is acceptable.
If this is correct then we have most likely only seen wave 1 blue of wave (5) black downwards. Wave 2 blue may not move beyond the start of wave 1 blue. This wave count is invalidated with movement above 1,208.47.
The next wave downwards could be a strong third wave if this wave count is correct.