
Elliott Wave chart analysis for the S&P 500 for 23rd August, 2011. Please click on the charts below to enlarge.
We had expected a little more downwards movement from the S&P 500 before the next wave upwards and this did not happen. Our wave counts on hourly charts were quickly invalidated by upwards movement.
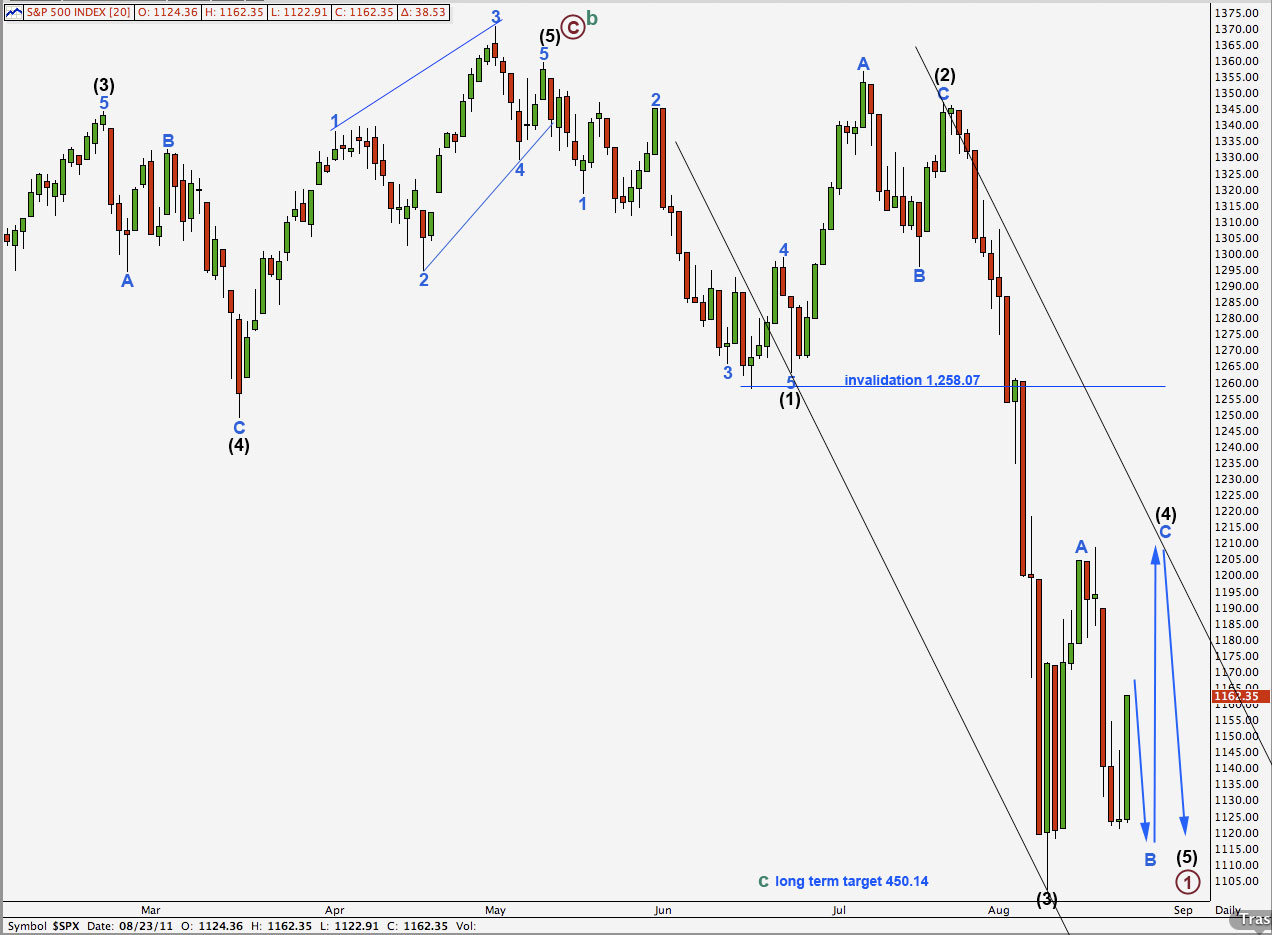
There are still several possibilities for wave (4) black and the only possibility that I will not continue to chart today is that (4) black could be over. This would still be a valid wave count, but wave (5) black would also probably be over and truncated. The probability that (4) black was over in 7 days, and that (5) black was truncated, is extremely low. I will continue to consider it, but at this stage it would add one more unnecessary chart to our analysis.
We have three hourly wave counts today. The first two see wave (4) black as a flat correction. The third sees wave (4) black as a triangle.
The end to wave (4) black is probably still at least a week away, if not a few weeks if it is a triangle. It looks very likely that wave (4) black will come to touch or overshoot the trend channel drawn here on the daily chart. We should continue to draw this channel on daily charts and expect the upper trend line to provide strong resistance to upwards movement.
Wave (4) black may not move into wave (1) black price territory. This wave count is invalidated with movement above 1,258.07.
First Hourly Wave Count.
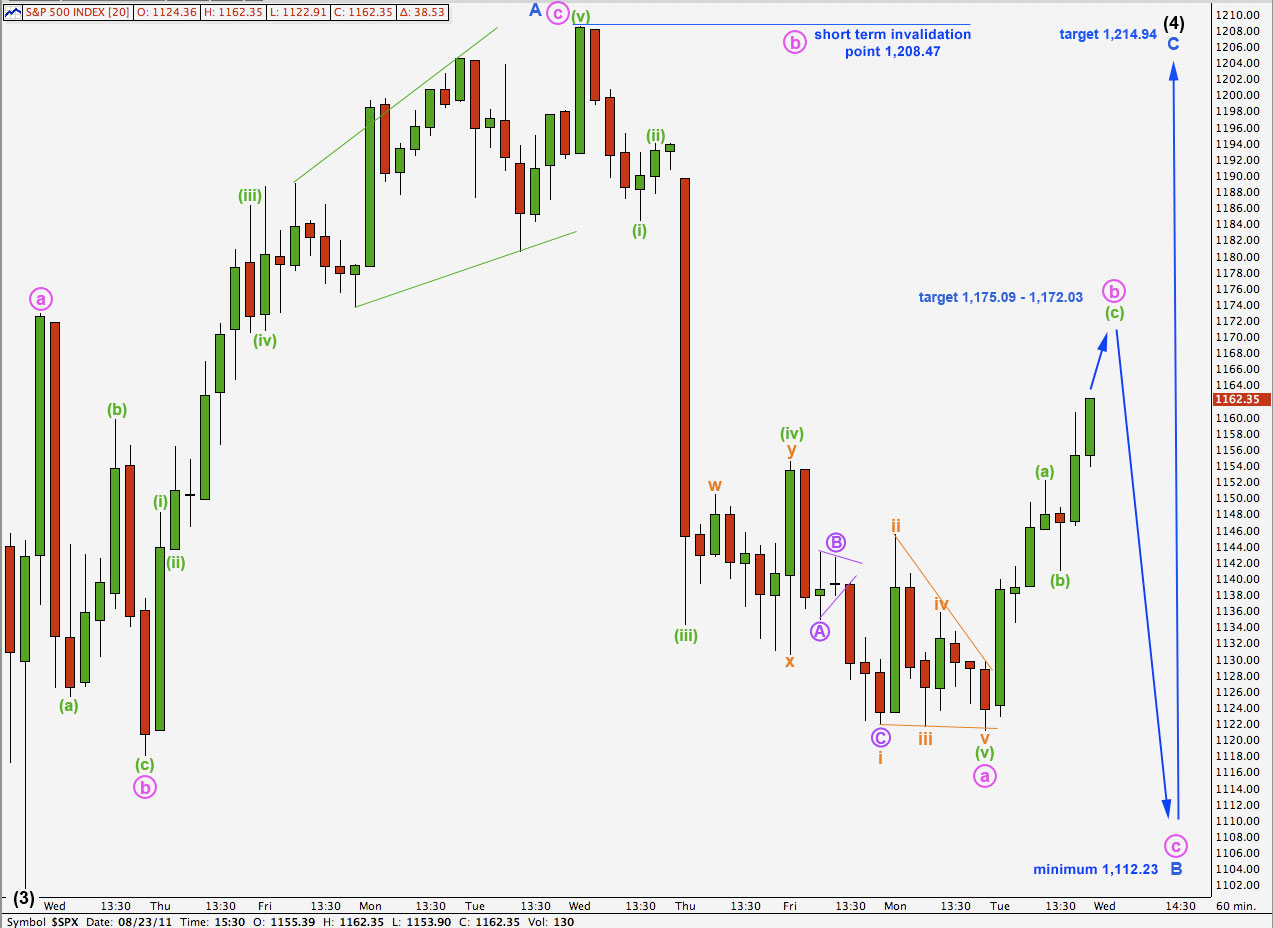
This first hourly wave count is an amalgamation of ideas I have covered before. It sees wave A blue within (4) black as over at the high of 1,208.47. If this is the end of a zigzag for wave A then the following downwards wave cannot be wave B blue in its entirety because it is a five. Therefore, wave B blue is incomplete.
Upwards movement for Tuesday’s session has a complete impulse for wave (a) green. Wave (c) green looks to be incomplete on the 1 and 5 minute chart. At 1,172.03 wave (c) green would reach equality with wave (a) green, and this is very close to the 0.618 Fibonacci ratio of wave a pink at 1,175.09. This gives us a small target for upwards movement to complete tomorrow.
Thereafter, a final wave downwards for wave c pink would end the zigzag for wave B blue.
Because wave A blue subdivides into a three wave structure wave (4) black is likely to be a flat. Wave B blue must be at least 90% the length of wave A blue. This is achieved at 1,112.23 and gives us a minimum expectation for the end of wave B blue. Wave B may make a new low beyond the start of wave A blue.
Second Hourly Wave Count.
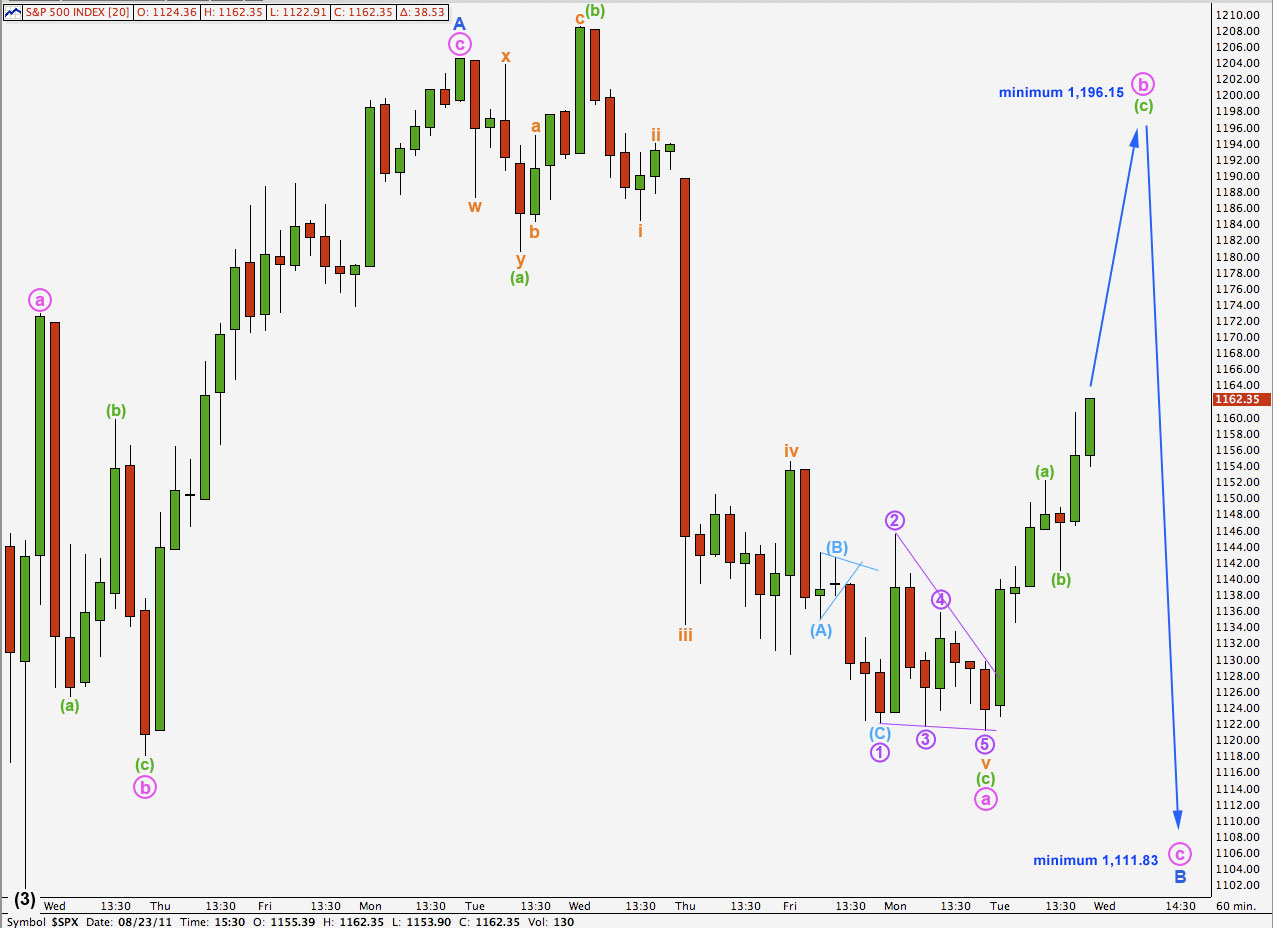
The main difference between the first hourly wave count and this second count is the end of wave A blue. This second hourly wave count fits slightly better with subdivisions as seen on the 5 minute chart within the end of wave A blue.
Because wave A blue was a clear three wave structure wave (4) black is here also seen as a flat correction. The low at 1,121.09 is less than 90% the length of wave A blue. Wave B must reach at least 90% the length of wave A blue, and so it is likely that it is incomplete.
Because wave a pink was a three wave structure then wave b pink must reach 90% its length. This would be achieved at 1,196.15. If price reaches up to this point or above in the next one to few days then this will be our preferred wave count. At that stage we could also eliminate the possibility of a triangle.
Although there is no ratio between waves (a) and (c) green within wave a pink, all subdivisions fit and this structure is complete.
The upper invalidation point would be the same as on the daily chart. There is no closer invalidation point because wave b pink may make a new price extreme beyond the start of wave a pink.
Third Hourly Wave Count.
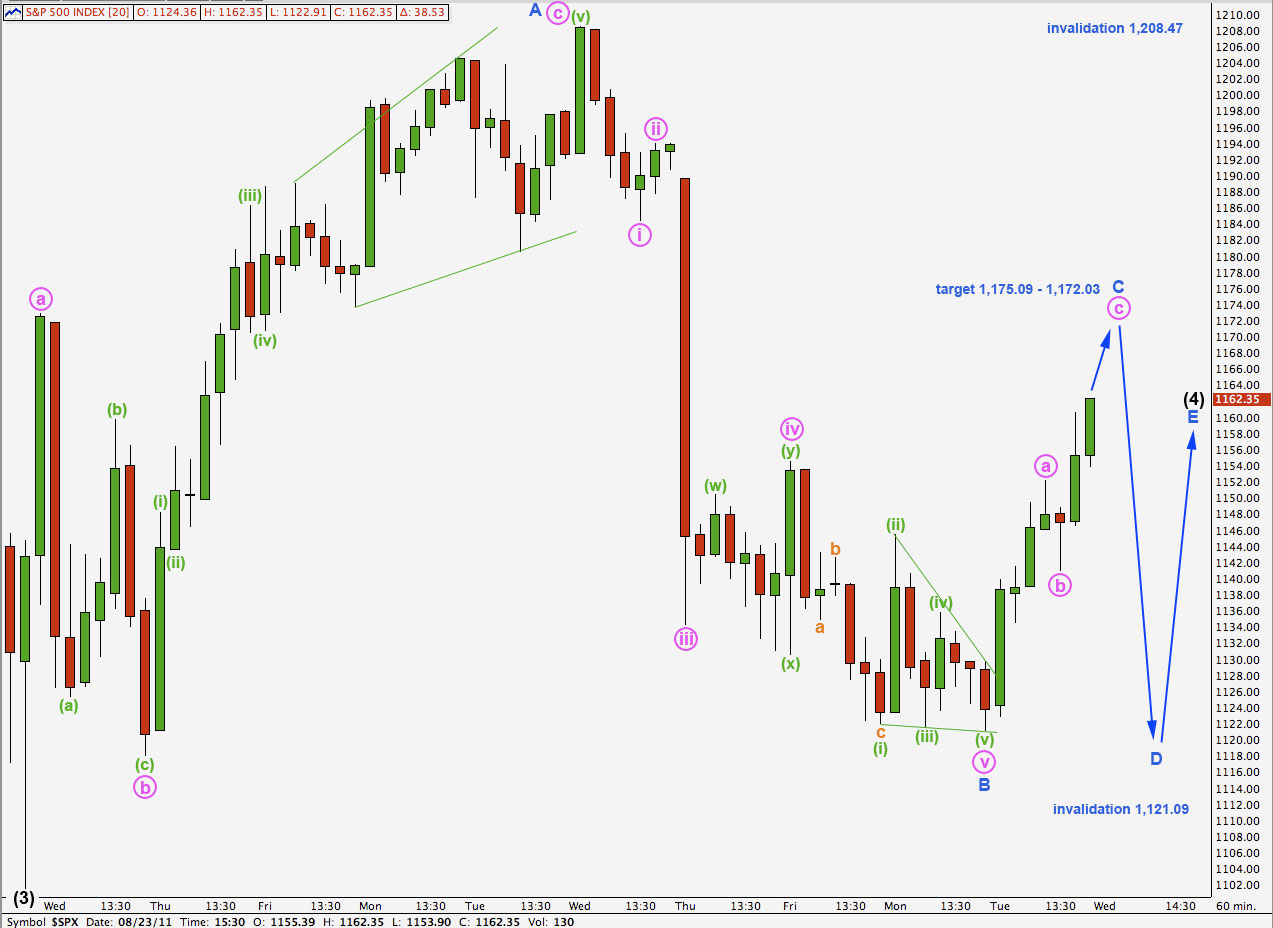
This wave count has the lowest probability of the three today.
This wave count looks at the possibility that wave (4) black is a triangle.
This can only be the case if wave A blue ended at the high of 1,208.47. This sees wave B blue as a five wave structure. This does fit within rules, four of the five subwaves of a triangle must be either zigzags or zigzag combinations which leaves one subwave which may be another structure. However, the probability that a B wave, even one within a triangle, would subdivide into a five is extremely low.
The only reason that I am considering this as possible is because wave B blue has reached 81% the length of wave A blue and I have found this wave length to be fairly common for triangles.
We would still expect it to be most likely that wave C blue would be incomplete and tomorrow should see further upwards movement. The target is the same as for the first hourly wave count.
If (4) black is a contracting (or barrier) triangle then wave C blue may not move beyond the end of wave A blue above 1,208.47, and wave D blue may not move beyond the end of wave B blue at 1,121.09 (unless this is a barrier triangle then D could end very slightly below this point).