
Elliott Wave chart analysis for the S&P 500 for 22nd August, 2011. Please click on the charts below to enlarge.
The S&P moved mostly sideways within a large range and the situation is little changed since last analysis. Price has remained below the invalidation point on the second alternate wave count.
We still have three hourly wave counts. The first is the most likely and the second alternate is unlikely.
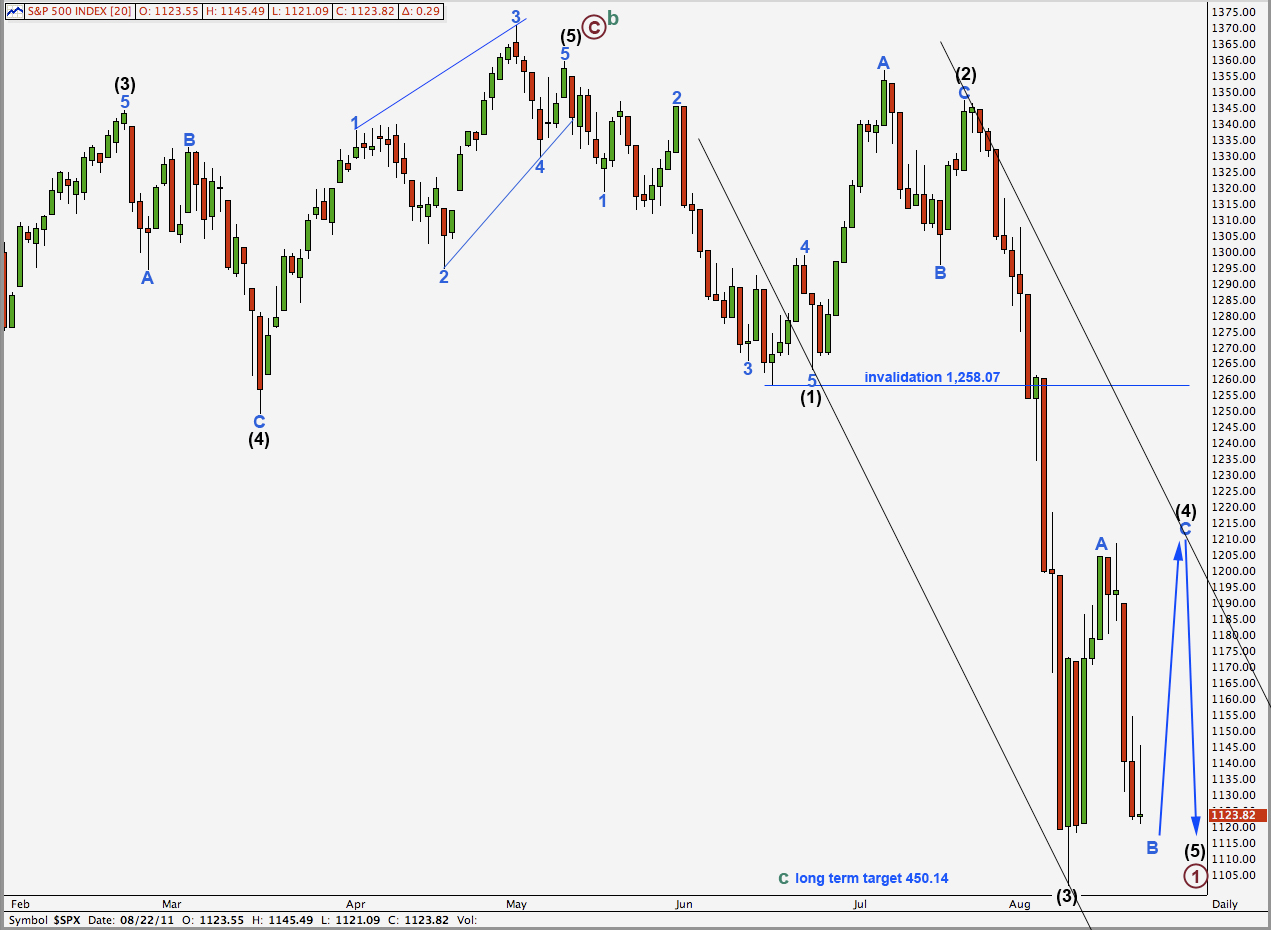
Wave (4) black is unlikely to be over yet. It may continue to move price sideways in a large range for another week or so. Wave (4) black is likely to end about the upper edge of the parallel channel here on the daily chart.
When wave (4) black is complete we shall expect a final intermediate degree wave downwards for (5) black to complete primary wave 1.
Wave (4) black may not move into wave (1) black price territory. This wave count is invalidated with movement above 1,258.07.
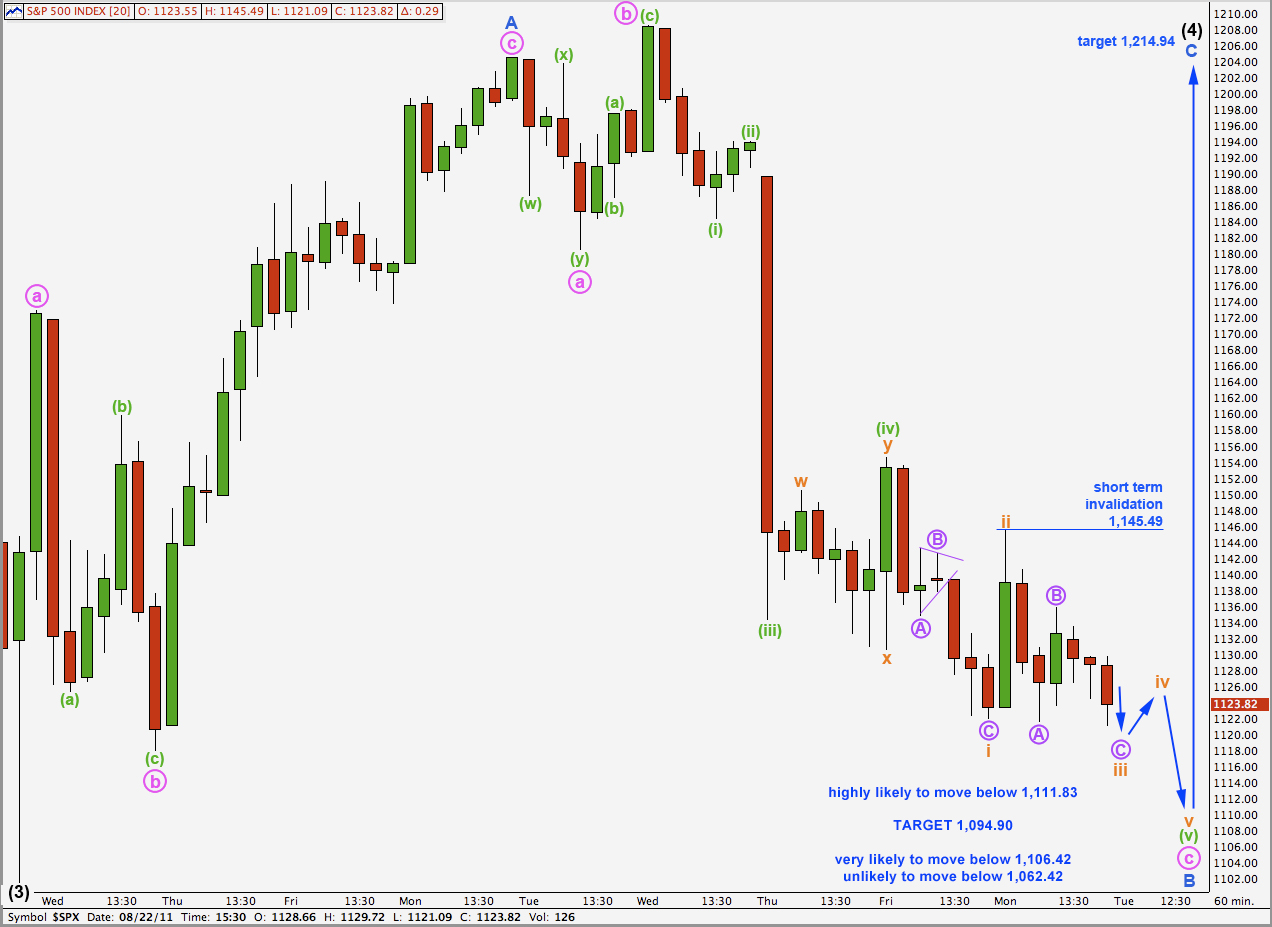
Upwards movement to 1,154.54 (the high labeled ii orange) at the beginning of Monday’s session was not what we had expected.
Wave (v) green has a lot of choppy overlapping movement. It looks like it is an ending diagonal unfolding. Within wave i orange wave B purple is a perfect triangle on the five minute chart; if wave i orange was an impulse this could not be seen as a triangle, or it could be in a second wave position. For this reason I expect an ending diagonal structure here is highly likely.
Wave iii orange has met the minimum requirement that it move beyond the end of wave i orange at 1,122.05, but it is unlikely to be over yet. At 1,112.02 wave C purple within wave iii orange would reach equality with wave A purple. This is a short term target which should be met in the first half of the next session.
Thereafter, wave iv orange should unfold upwards as a zigzag. It should overlap wave i orange price territory and move above 1,122.05. Wave iv orange may not move beyond the end of wave ii orange. This wave count is invalidated with movement above 1,145.49 in the short term.
A final zigzag downwards would end wave B blue at all degrees.
At 1,111.83 wave B blue would reach 90% the length of wave A blue, a minimum requirement for a B wave within a flat. It is highly likely that price will reach down to this point as the probability of wave (4) black as a flat is higher than for a triangle.
At 1,094.90 wave (v) green would reach equality with wave (iii) green. This is our target for downwards movement to end temporarily.
At 1,106.42 wave B blue would reach 105% the length of wave A blue. This is a minimum requirement for an expanded flat correction, which is the most common type of flat.
At 1,062.42 wave B blue would reach 138% the length of wave A blue. This is the maximum common length of wave B in relation to wave A of a flat.
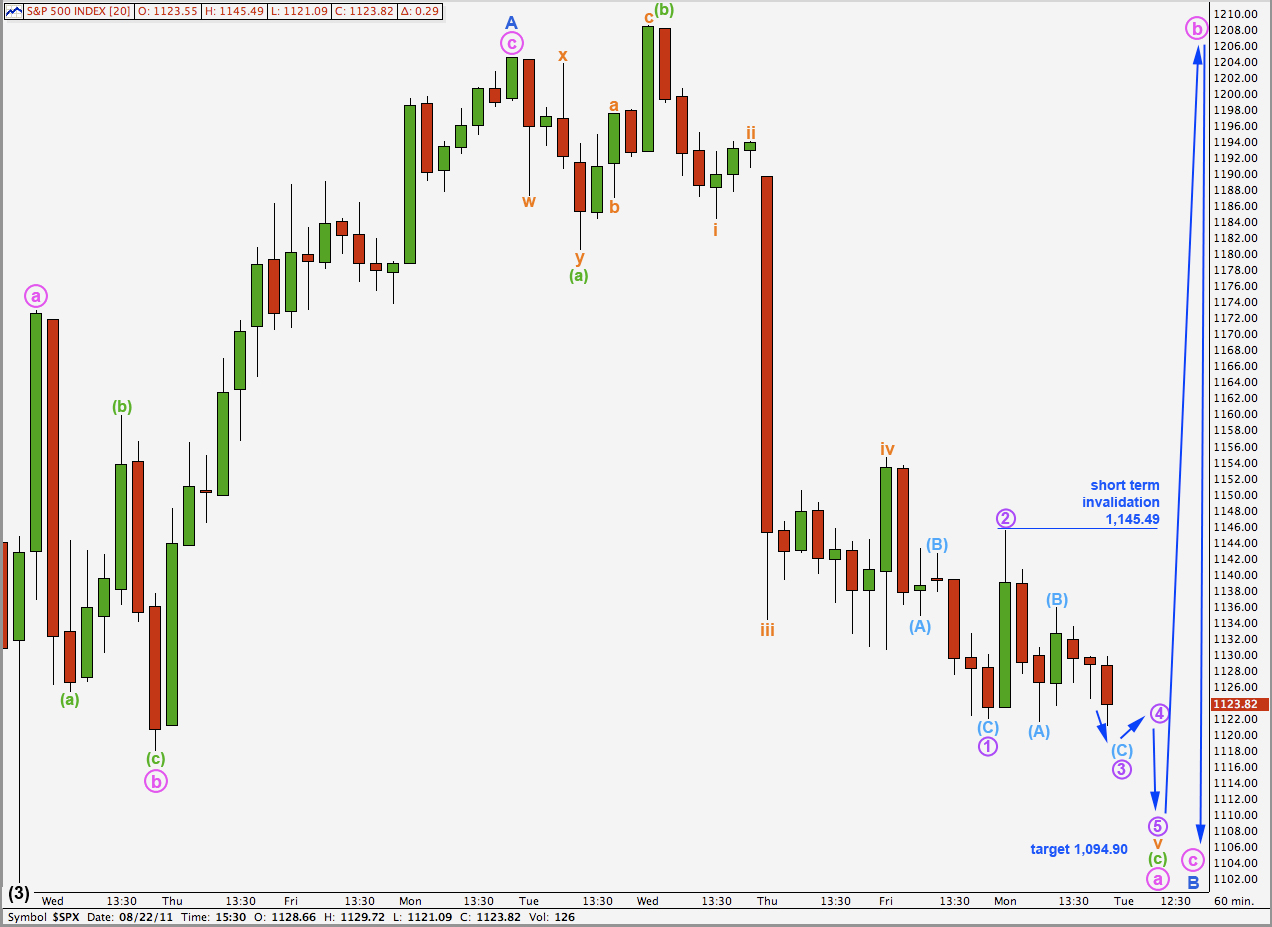
This wave count differs from the first hourly wave count only in the degree of labeling for downwards movement from the high labeled A blue.
Wave B blue is here seen as unfolding as an exaggerated time consuming flat correction.
Wave (4) black would take another two or so weeks to end if this is the correct wave count.
The short term targets, invalidation points and expectations are exactly the same as the first hourly wave count. There is no divergence in the short term between the two.
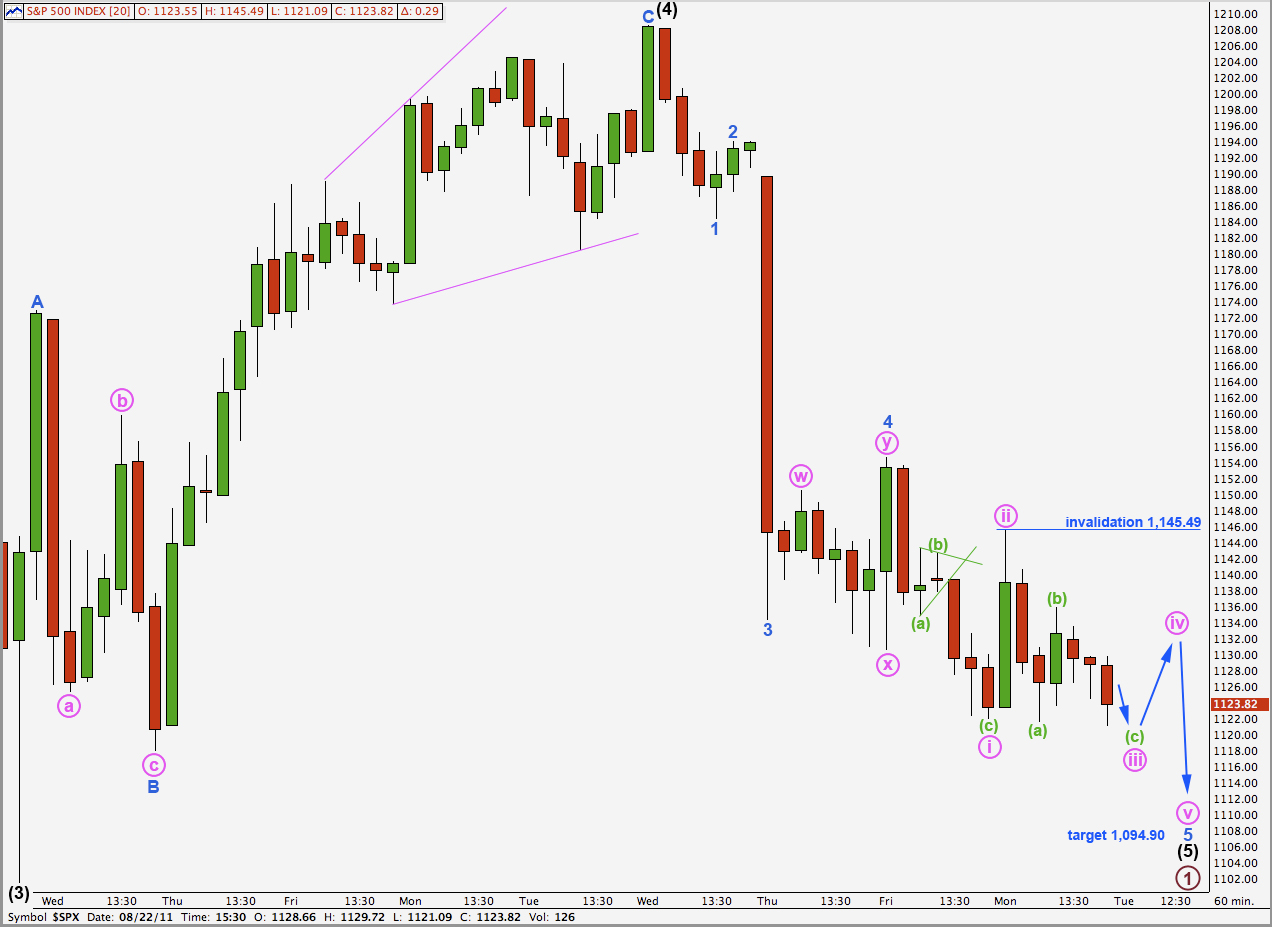
It is possible still that wave (4) black is complete and recent downwards movement is wave (5) black to end primary wave 1.
This wave count has the lowest probability of all three today because it is unlikely that wave (4) black was over in just 7 days.
In the short term the structure, targets and invalidation points are the same as the first two hourly wave counts.