
Elliott Wave chart analysis for the S&P 500 for 19th August, 2011. Please click on the charts below to enlarge.
As expected we saw downwards movement from the S&P 500 for Friday’s session, and although the session began with some upwards movement price remained below our invalidation point.
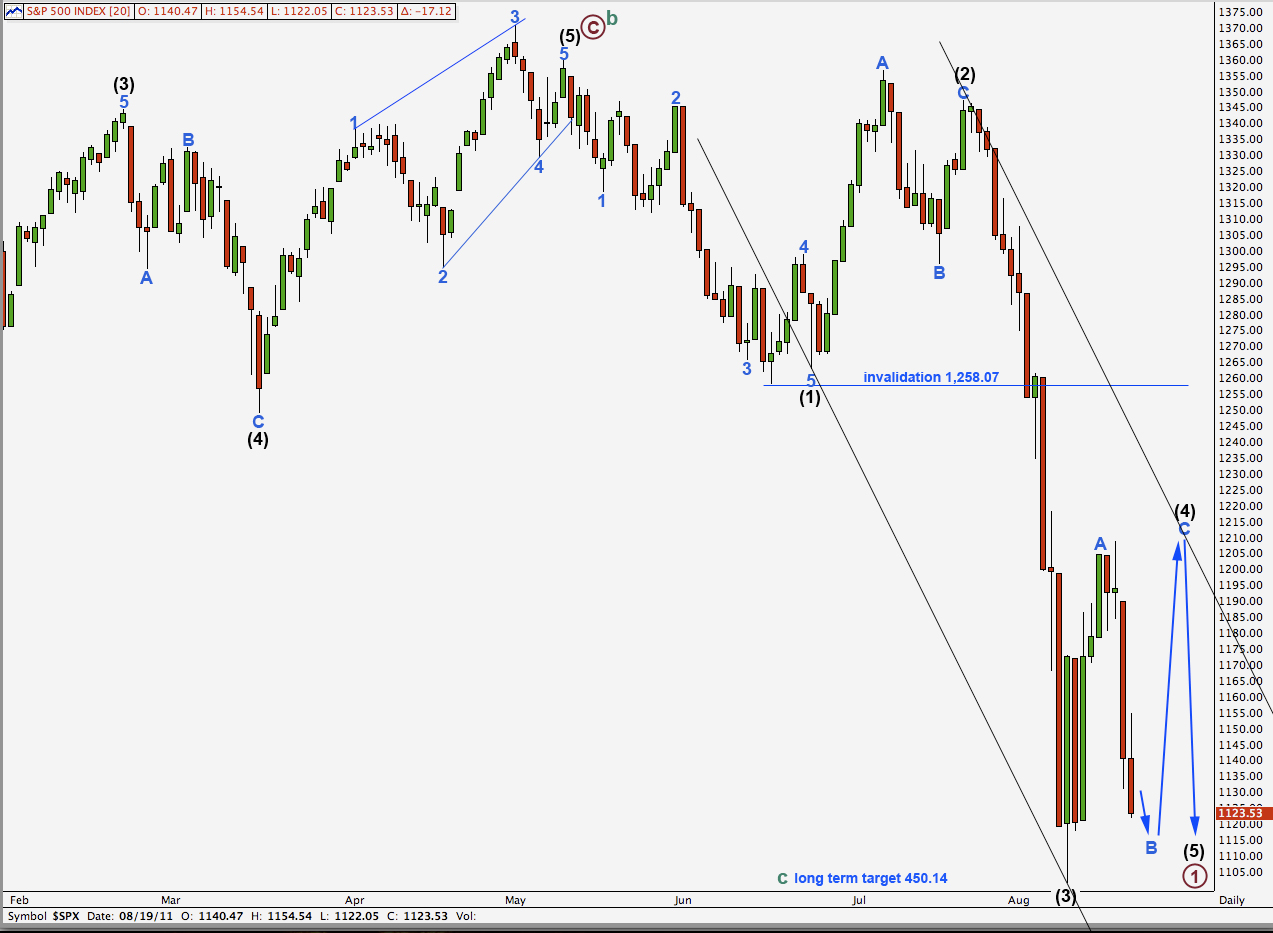
Wave (4) black is unfolding pretty much as expected so far. It may take another week or so to complete and this may be long enough to bring price to contact the upper edge of the parallel channel here on the daily chart. This would give this downwards impulse a very typical look.
Wave (4) black may not move into wave (1) black price territory. This wave count is invalidated with movement above 1,258.07.
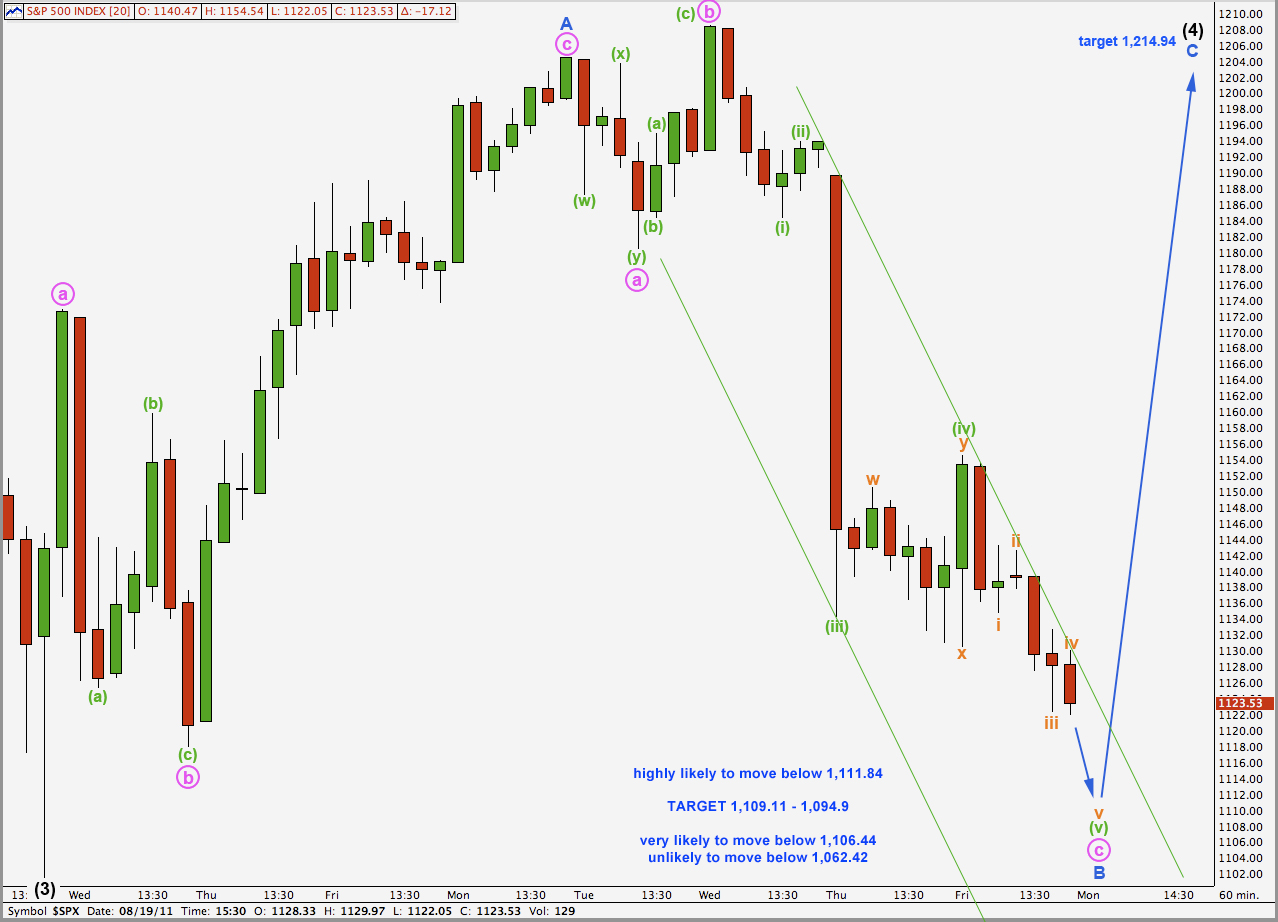
Wave B blue has moved lower as we expected, after wave (iv) green first moved higher as a double zigzag structure.
Wave (iii) green within wave c pink is 3.48 points short of 2.618 the length of wave (i) green. At 1,094.90 wave (v) green would reach equality with wave (iii) green.
Within wave (v) green wave iii orange is 1.17 points longer than equality with wave i orange. At 1,109.11 wave v orange would reach equality with wave iii orange.
This gives us a target zone of 1,109.11 to 1,094.90 for Monday.
It is also technically possible that wave v orange is complete as it is very close to 80% the length of wave A blue. If we do not see movement to 1,111.83 or below on Monday then the possibility that wave (4) black is unfolding as a triangle will increase. I have found that subwaves of triangles are often about 80% the length of each predecessor.
Alternate Hourly Wave Count.
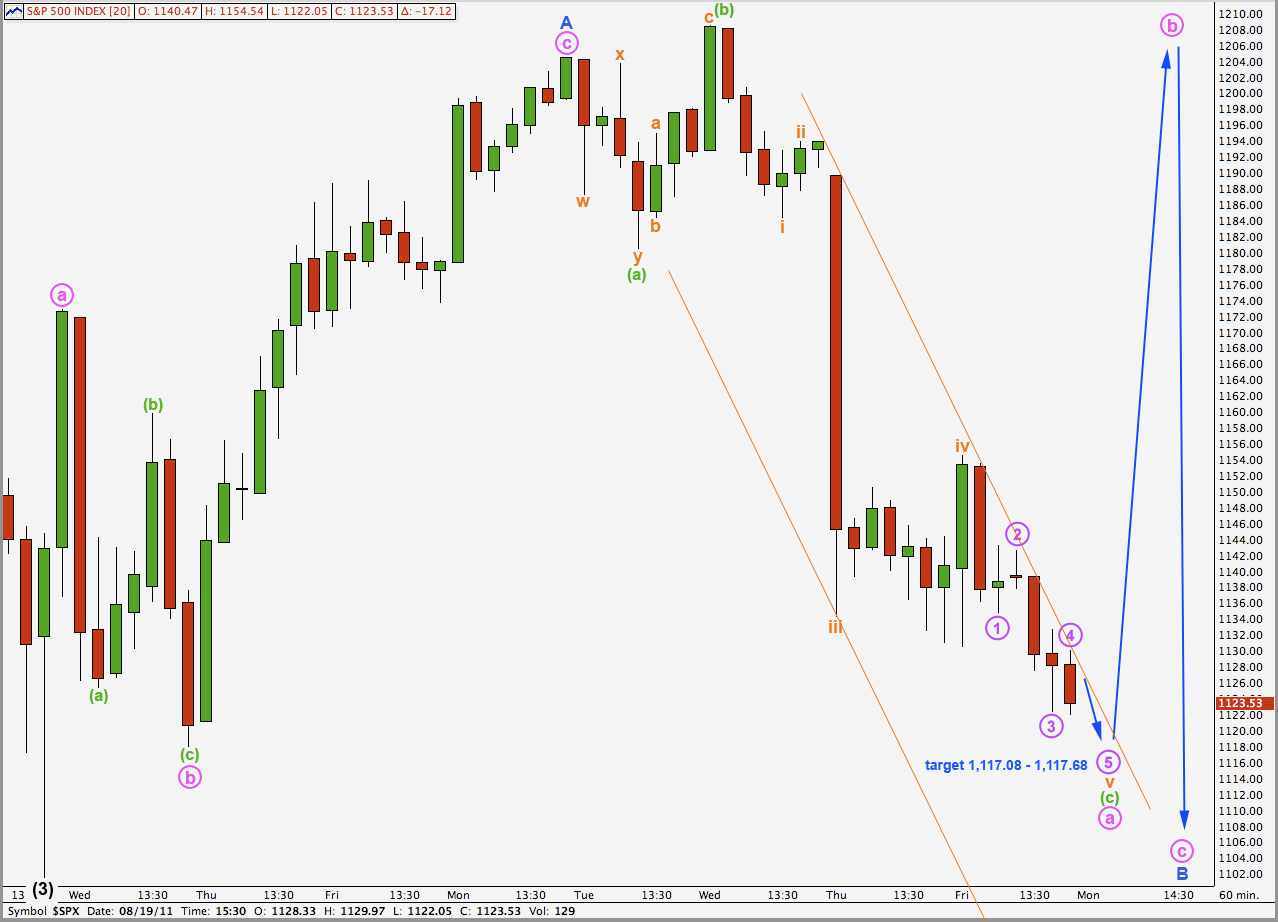
If price does not move to 1,111.83 or below on Monday then this alternate will also increase in probability.
At 1,117.68 wave v orange would reach 0.618 the length of wave iii orange. At 1,117.08 wave 5 purple within wave v orange would reach 0.618 the length of wave 3 purple. This gives us a target about 1,117 for a little more downwards movement on Monday for this alternate wave count.
Thereafter, wave b pink upwards must be a three wave movement.
It is fairly common to see b waves as large exaggerated three wave movements and so this alternate wave count is a likely possibility that we must continue to consider.
In the short term there is again no divergence between this alternate and the main hourly wave count in terms of our expectations for Monday. But they will diverge significantly in coming days so we must continue to consider them both.
Second Alternate Wave Count.
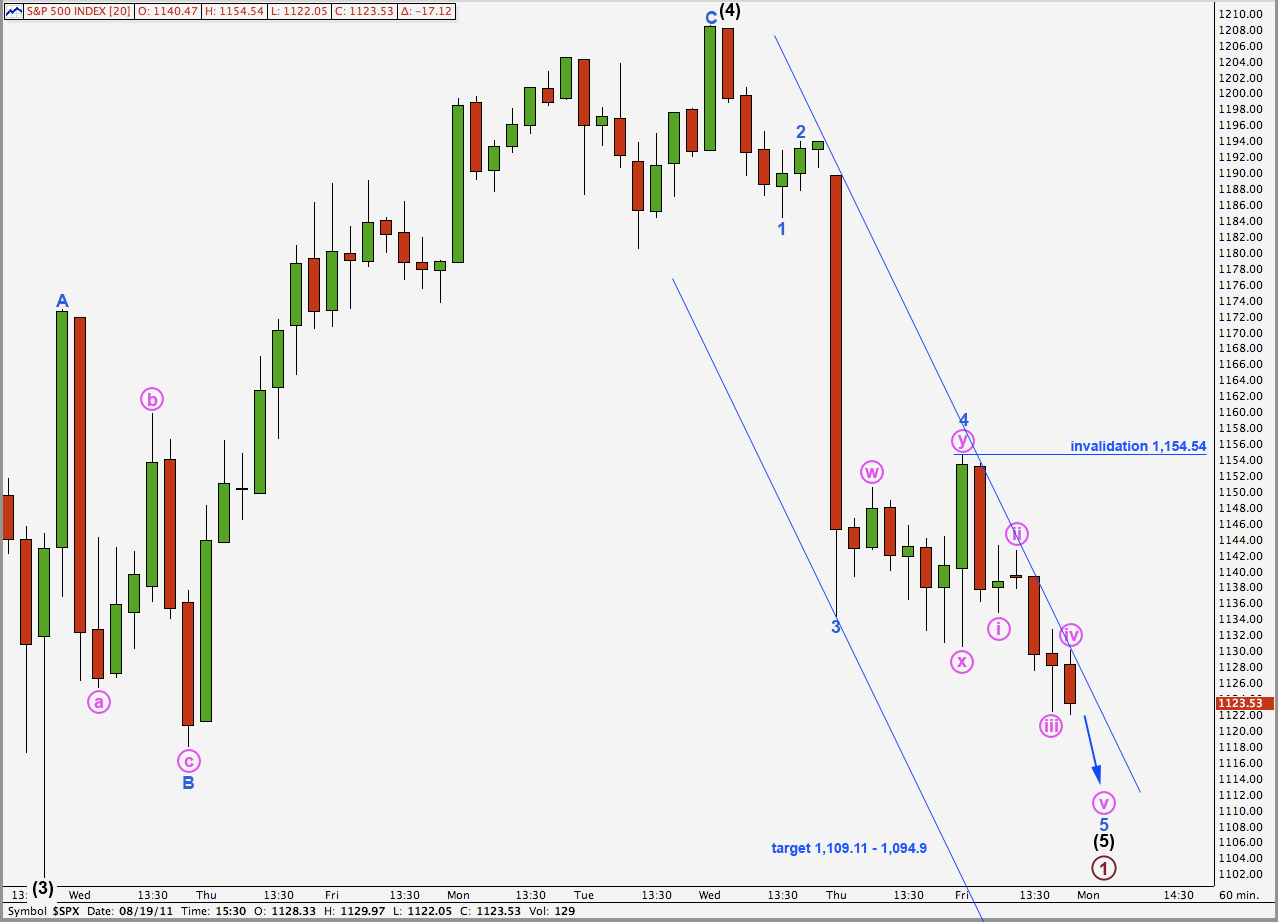
The targets for downwards movement are the same as the first hourly wave count.
This alternate sees the possibility that wave (4) black is complete and that downwards movement is wave (5) black to end primary wave 1.
This is possible, but less likely than our first two hourly wave counts. Wave (4) black would be a remarkably brief 7 days in duration.
If this target is reached then wave (5) black would be truncated. This is possible, but a truncation reduces the probability of this wave count still further.
If price moves to a new low below 1,101.54 in the next day or so this wave count will be a little more valid.