
Elliott Wave chart analysis for the S&P 500 for 18th August, 2011. Please click on the charts below to enlarge.
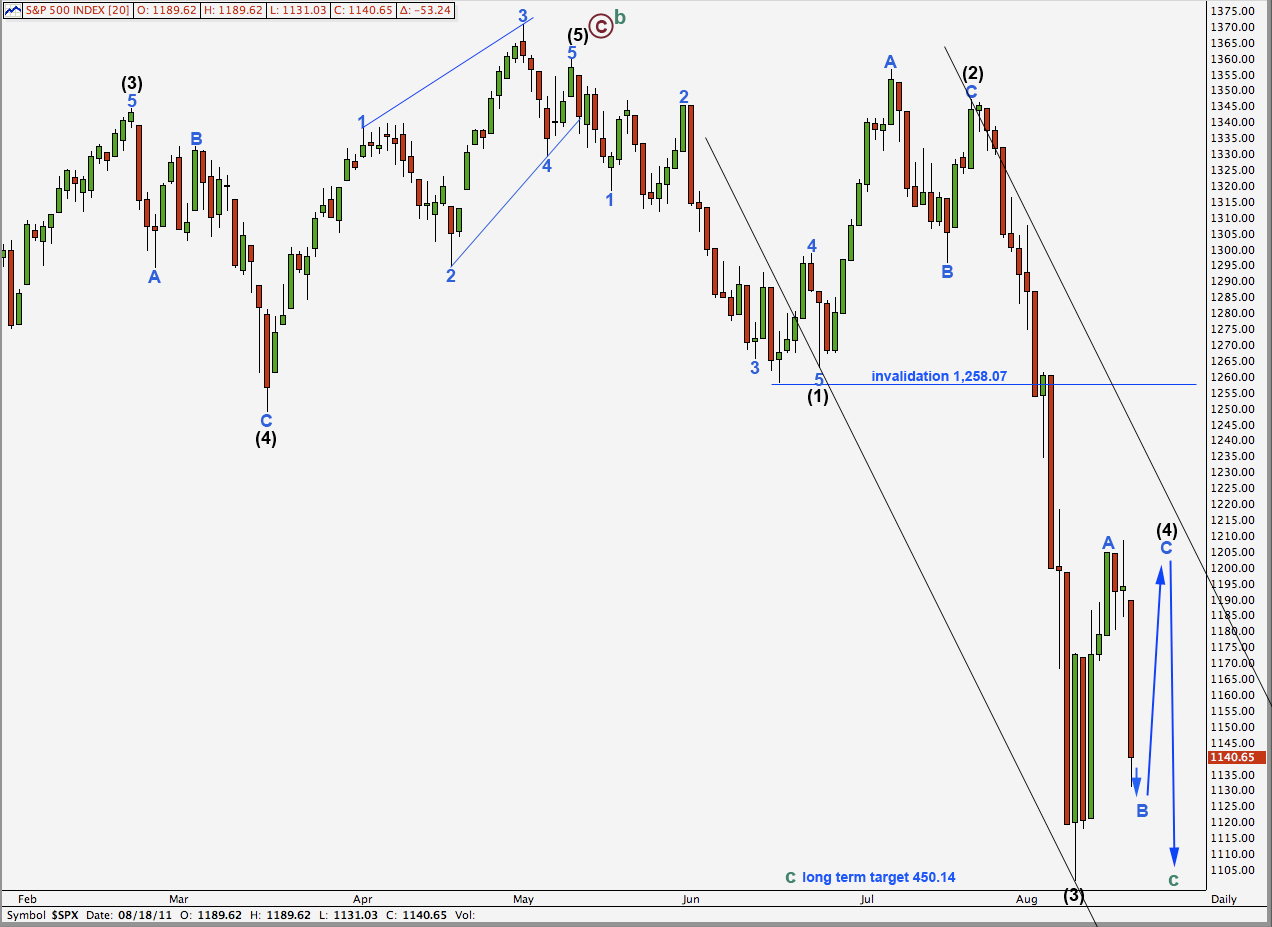
As expected the S&P moved lower for Thursday’s session and downwards movement had strong momentum which is typical for a third wave.
At this stage there at least three alternate wave counts on the hourly chart which me must consider. They differ mostly in the degree of labeling we apply, and have different implications.
Wave (4) black is unlikely to be complete as it would have lasted only 6 days which is very brief for an intermediate degree wave.
What is most likely is that we have yet to see the final C wave upwards for wave (4) black. This is our main and alternate hourly wave count.
Wave (4) black may not move into wave (1) black price territory. This wave count is invalidated with movement above 1,258.07.
Main Hourly Wave Count.
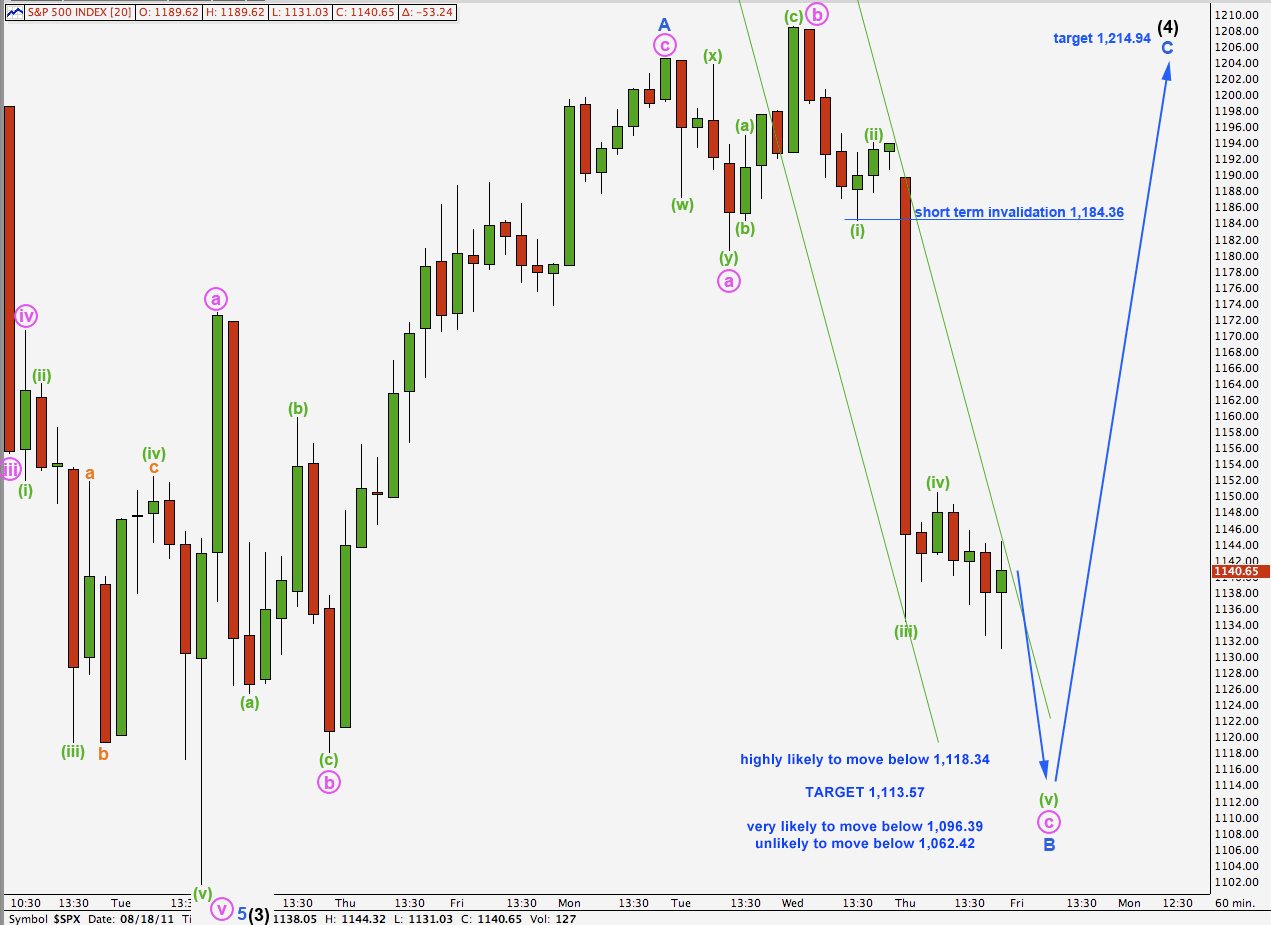
This wave count has the most typical look and so is our main hourly wave count.
Our lower target for yesterday’s downwards movement to end was at 1,145.74. Price reached 14.71 points below this target.
The structure within the final fifth wave down, wave (v) green, within wave c pink, is incomplete on the 5 minute chart. This wave count requires further downwards movement to complete a five wave structure for wave c pink.
Because downwards movement is deeper than we expected we may move the degree of labeling for it up one degree. This may be wave B blue almost complete within wave (4) black.
Because wave A blue subdivided into a three wave structure wave (4) black is likely to be a flat correction. A flat requires wave B to be at least 90% the length of wave A. This would be achieved at 1,118.34.
At 1,113.57 wave (v) green would reach 0.618 the length of wave (iii) green. This is our target for downwards movement to end tomorrow.
If wave (4) black is unfolding as an expanded flat correction then wave B blue must be at least 105% the length of wave A blue. This is achieved at 1,096.39.
Wave B within a flat is unlikely to be longer than 138% the length of wave A blue. If this wave count is correct then it is unlikely that we shall see movement below 1,062.42 tomorrow.
Wave (iv) green may be over as labeled, or this may be only wave a orange if wave (iv) green is continuing further sideways as a flat correction. Wave (iv) green may not move into wave (i) green price territory. In the short term movement above 1,184.36 would invalidate this wave count.
When wave (v) green ends wave c pink then we shall expect another trend change for the S&P. Wave c pink should move price higher in a five wave structure which is extremely likely to move above the end of wave a pink making a new high above 1,204.49.
At that stage we shall expect wave (4) black to most likely end about the fourth wave of one lesser degree at 1,214.94. When we know where wave b pink has ended and wave c pink has started we may use the ratio between waves a and c pink to refine this target.
First Alternate Hourly Wave Count.
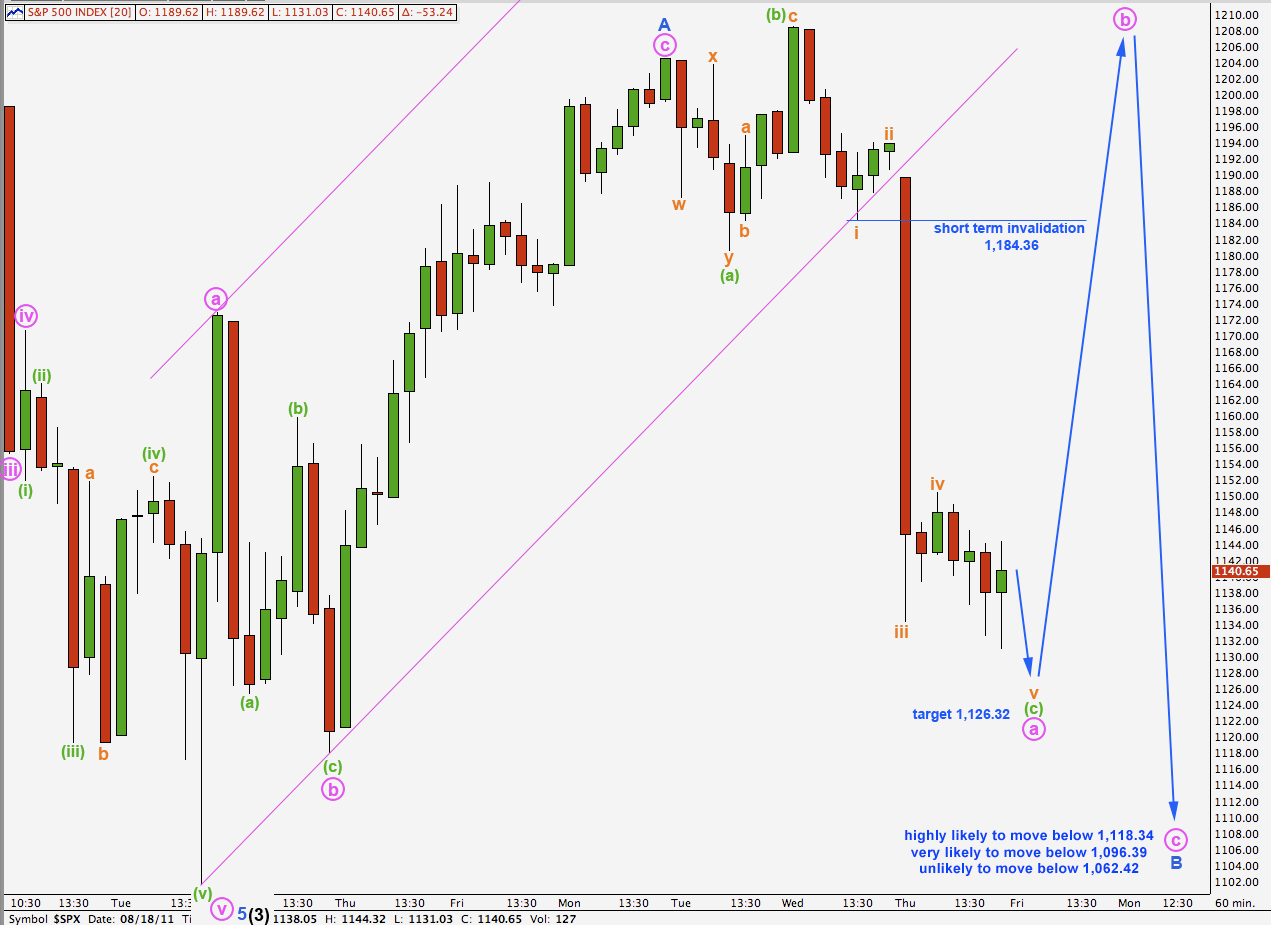
This wave count follows on directly from yesterday’s main hourly wave count.
Within wave B blue I have moved the degree of labeling back down one degree. This may be only wave a pink within wave B blue if wave B blue is unfolding as a more time consuming flat correction (or triangle).
At 1,126.32 wave v orange within wave (c) green would reach equality with wave i orange. This would end a three wave structure for wave a pink.
Thereafter, we should expect upwards movement for wave b pink in three waves.
This wave count does not require movement below 1,096.36. If downwards movement ends above 1,096.36 then this wave count will be favoured. We would then expect more choppy overlapping movement next week as well while wave (4) black continues further sideways in this large range.
Second Alternate Hourly Wave Count.
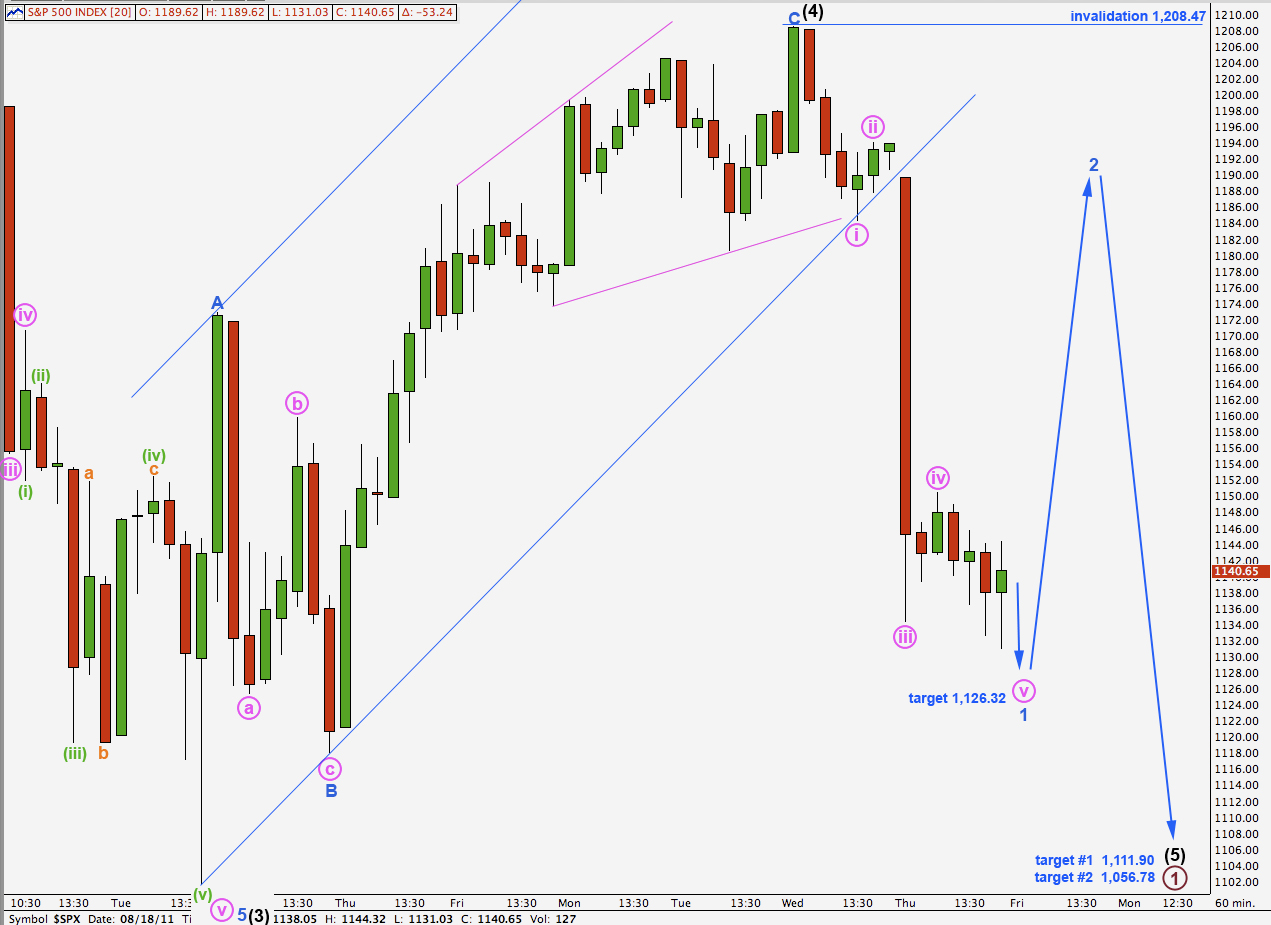
This second alternate hourly wave count follows on directly from yesterday’s alternate hourly wave count.
This wave count also expects further downwards movement tomorrow as most likely for wave v pink to end wave 1 blue.
Wave 2 blue to follow may not move beyond the end of wave 1 blue. This wave count is invalidated with movement above 1,208.47.
If this wave count is correct then wave (5) black may be unfolding as a simple impulse.
There is no divergence between our three wave counts for tomorrow; all expect at least some downwards movement. The depth of this downwards movement only differs.