
Elliott Wave chart analysis for the S&P 500 for 16th August, 2011. Please click on the charts below to enlarge.
Yesterday we had expected upwards movement from the S&P 500 but it moved downwards. This particular turning point is proving difficult to analyse.
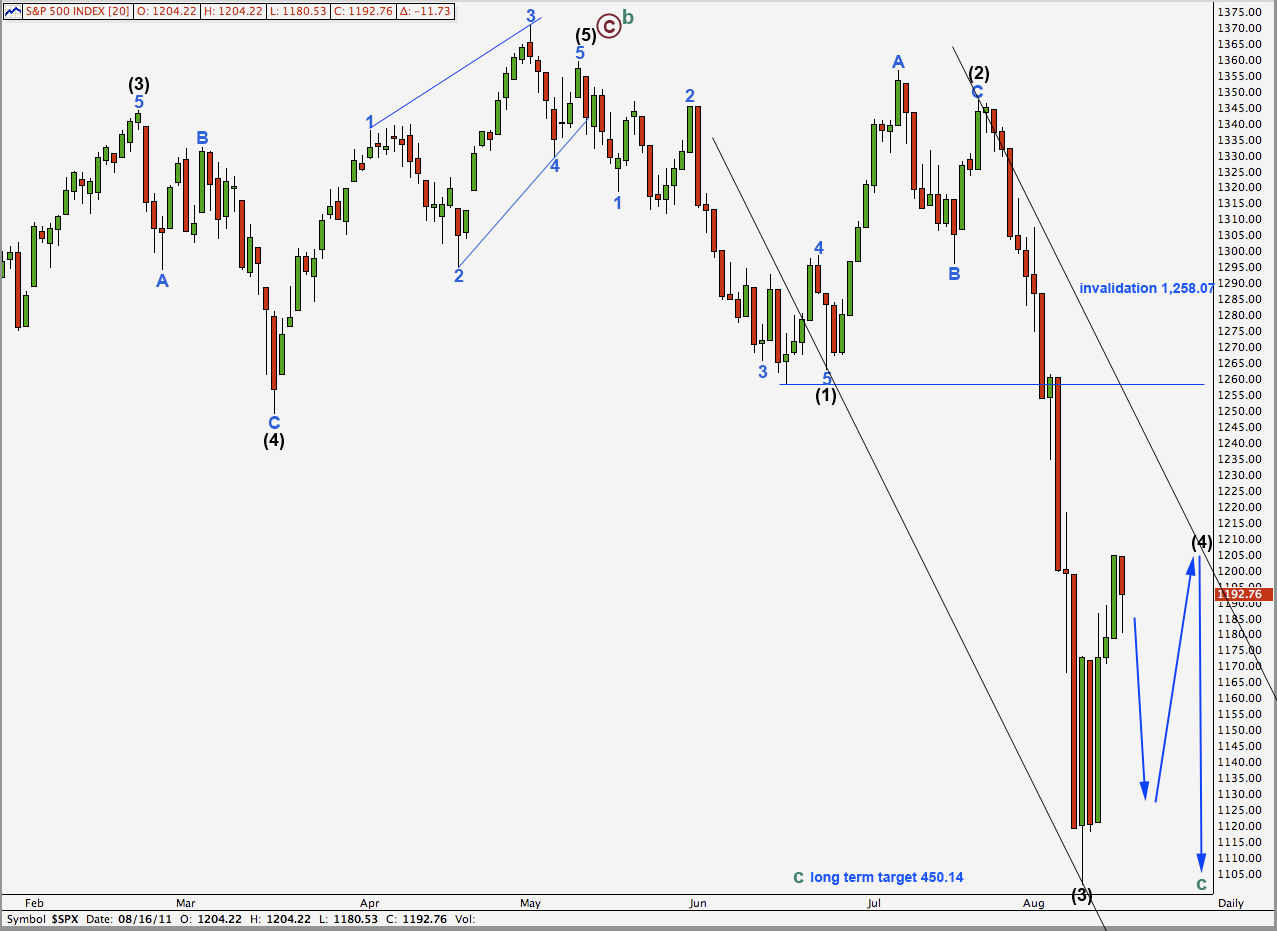
It is most likely that this upwards movement is the end of wave A blue within wave (4) black, and that wave (4) black will continue further yet as a flat correction, or possibly a triangle. It is unlikely to be over here.
When wave (4) black is complete we should expect a downwards movement to most likely make new lows for wave (5) black to complete primary wave 1.
Wave (4) black may not move into wave (1) black price territory. This wave count is invalidated with movement above 1,258.07.
Main Hourly Wave Count.
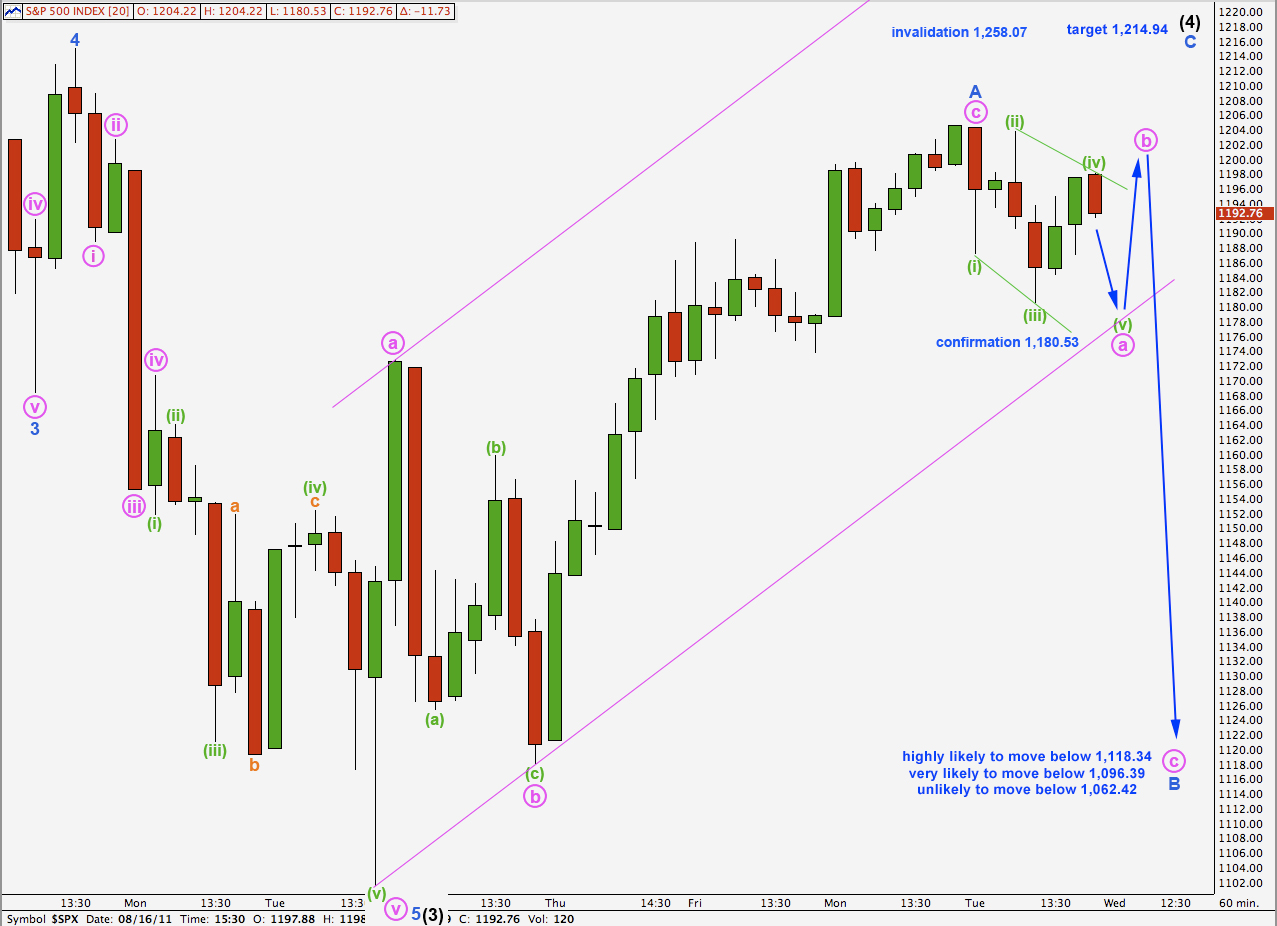
At this stage yesterday’s analysis of the 5 minute chart is invalidated. If price moves below 1,180.53 tomorrow then we shall have some confirmation that wave A blue is complete and wave B blue downwards is underway. This would complete a leading diagonal structure, and a leading diagonal may not have a truncated fifth wave. This would complete a five down on the hourly chart which would add confidence in a short term trend change.
If wave c pink was over at 1,204.49 then ratios within it are: wave (iii) green was just 0.74 points short of 2.618 the length of wave (i) green and wave (v) green was 3.26 points short of 0.618 the length of wave (iii) green.
Wave (4) black is most likely to be a flat correction. This requires wave B blue to be at least 90% the length of wave A blue. It is highly likely that downwards movement would reach at least to 1,118.34.
The most common type of flat is an expanded flat which requires wave B to be 105% the length of wave A blue. It is very likely that wave B blue will move below 1,096.39.
The most common length for wave B within a flat is 100% to 138% the length of wave A. It is unlikely that wave B blue will move below 1,062.42.
If wave B blue does not reach 90% the length of wave A blue at 1,118.34 then wave (4) black is likely to be a triangle.
Because wave B blue may be a flat correction which allows for wave b within it to move beyond the start of wave a within it, we cannot have an upper invalidation point at 1,204.49. Wave B blue may have a new high above this point.
Wave (4) black may not move into wave (1) black price territory. This wave count is invalidated with movement above 1,258.07.
At this stage the eventual end target for wave (4) black will remain about the fourth wave of one lesser degree at 1,214.94.
Alternate Hourly Wave Count.
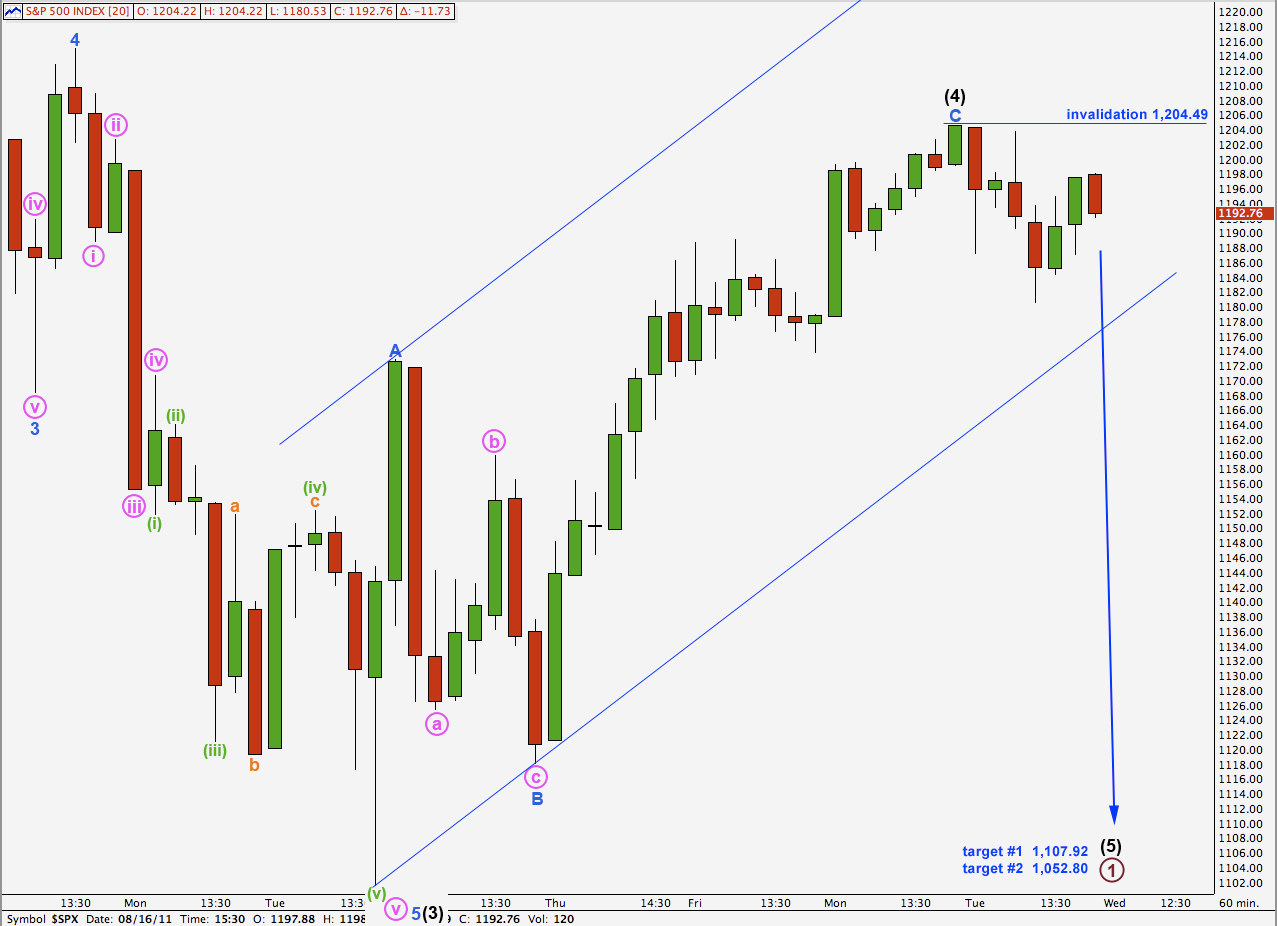
If we move the degree of labeling within wave (4) black up one degree it may be over. However, this would be a remarkably brief intermediate degree wave at just 5 days duration. For this main reason this wave count has a lower probability than the alternate.
There is alternation between waves (4) and (2) black in depth of correction: wave (2) was deep and wave (4) was shallow. They are both zigzags so there is no alternation between structure. However, within the zigzags there is alternation in the length of waves a in relation to c.
Wave (5) black would reach equality with wave (3) black at 1,107.92. Wave (5) black would reach 0.618 the length of wave (3) black at 1,052.80.
The first target is more likely.
This would end primary wave 1.