
Elliott Wave chart analysis for the S&P 500 for 15th August, 2011. Please click on the charts below to enlarge.
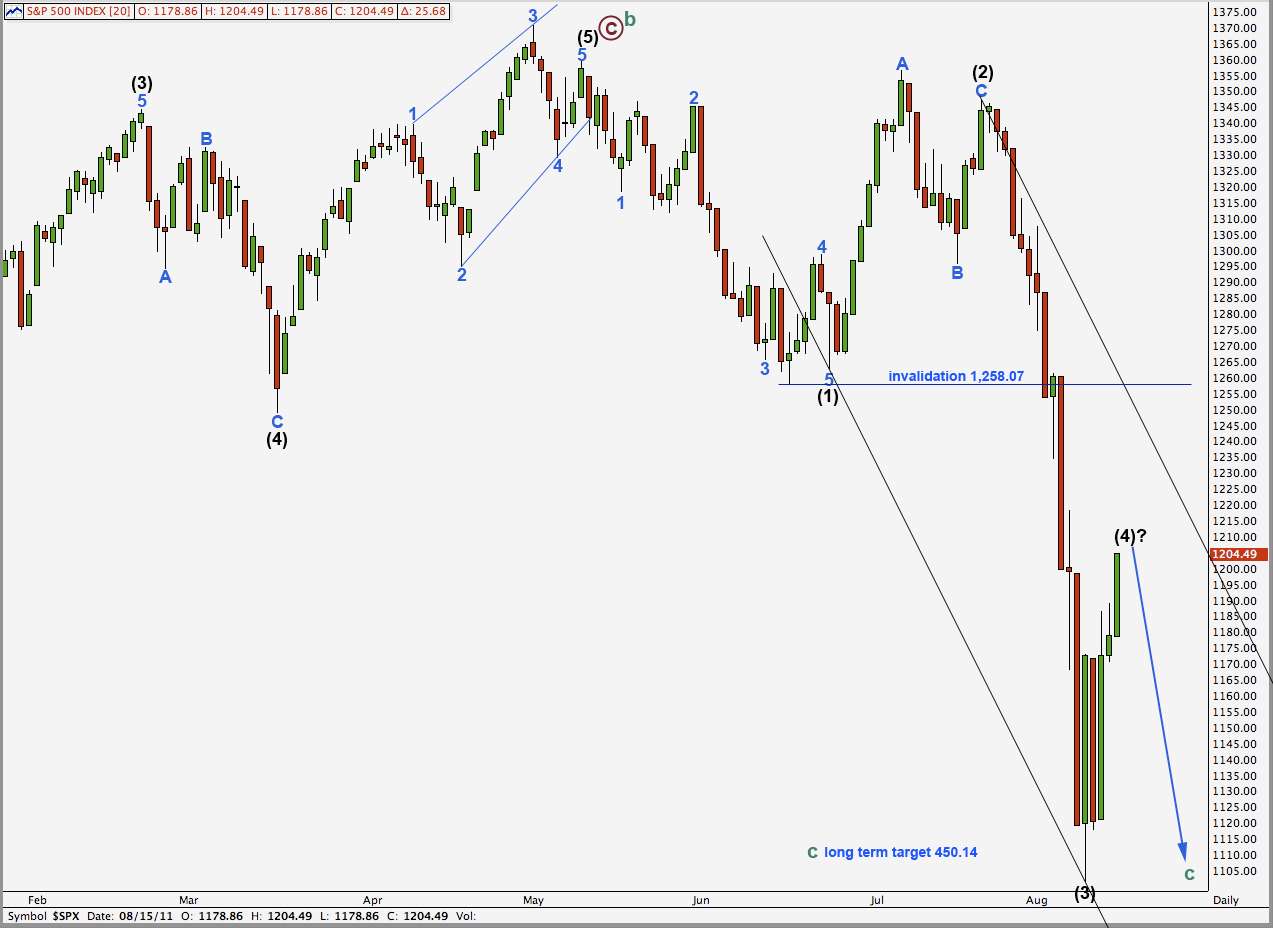
We had expected downwards movement for Monday’s session and the S&P moved higher. The zigzag unfolding upwards within wave (4) black is incomplete.
Wave (4) black requires at least a little further upwards movement before it may be considered over. It is most likely that only wave A blue within wave (4) black is nearing completion and that we shall see further sideways movement in this large range for another week or so.
When wave (4) black is complete we should expect a downwards movement to most likely make new lows for wave (5) black to complete primary wave 1.
Wave (4) black may not move into wave (1) black price territory. This wave count is invalidated with movement above 1,258.07.
Main Hourly Wave Count.
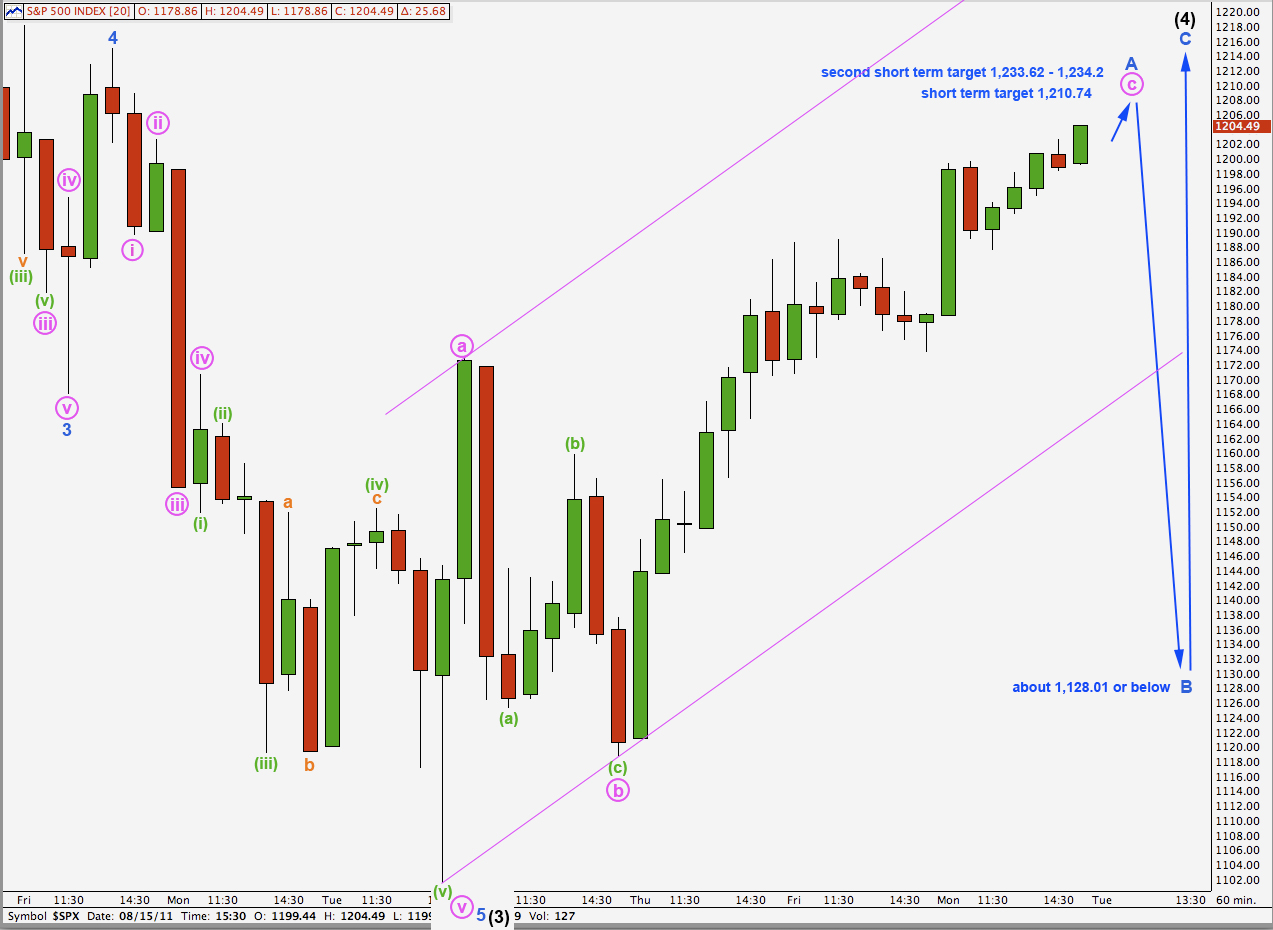
Wave c pink within the zigzag of wave A blue was not over at the end of last week as anticipated. It is continuing higher, and it may end without a Fibonacci ratio between waves a and c pink. If wave c pink were to reach 1.618 the length of wave a pink, the next expectation now that it has passed equality with wave a pink, it would end about 1,234.20. This is part of the calculation for the second target for tomorrow.
We may also use Fibonacci ratios within wave c pink to calculate a target for it to end. This is done on the 5 minute chart below.
We may use Elliott’s channeling technique to draw a channel about the zigzag for wave A blue. When this is breached by downwards movement we can have some confidence that wave A blue is complete and wave B blue should then be underway.
Wave B blue is most likely to be at least 90% the length of wave A blue about 1,128.01, or below. This calculation may change; it would need to be recalculated once we have the end of wave A blue confirmed.
Wave B blue downwards is most likely to be a three wave structure and may make a new low below 1,101.54.
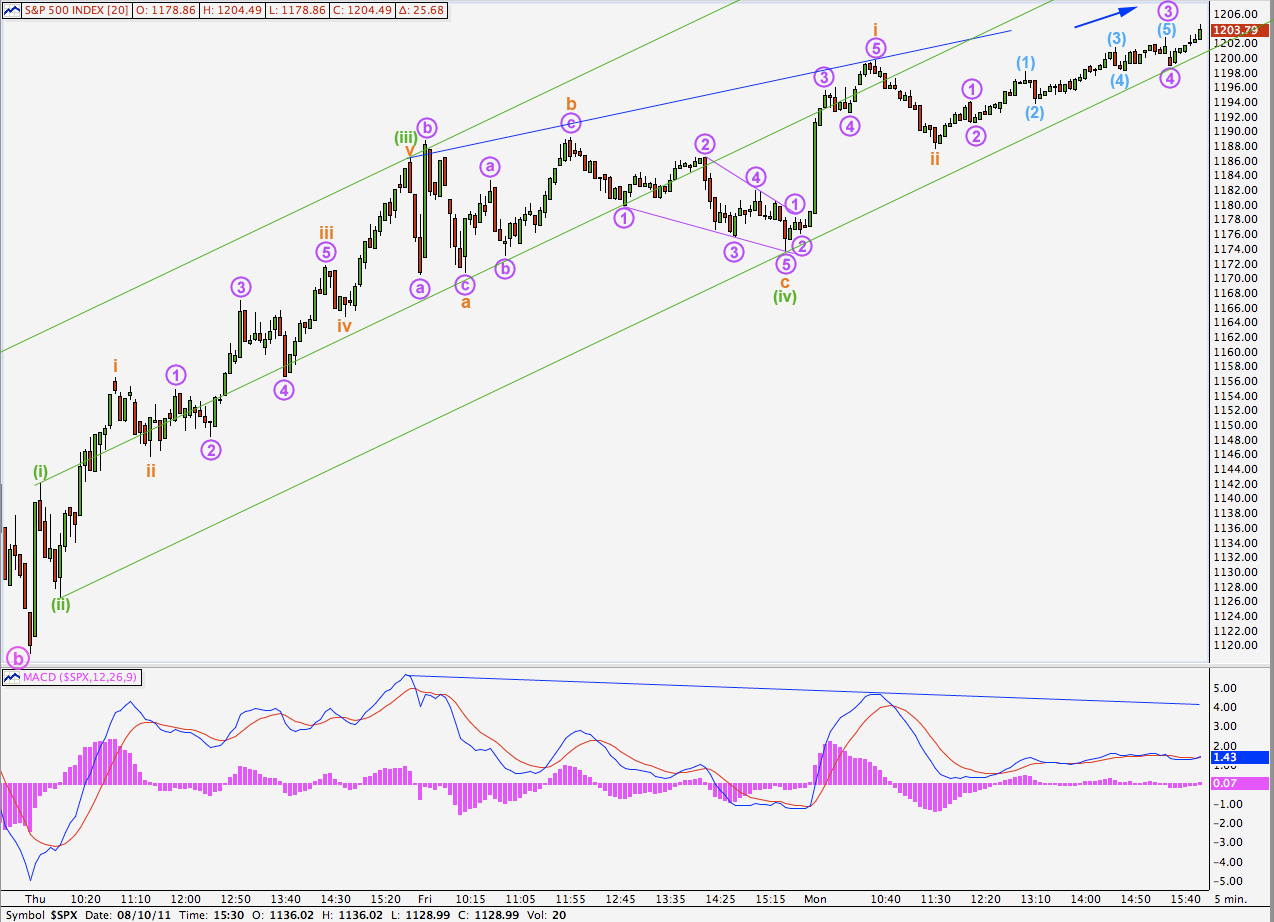
The 5 minute chart above shows the most likely breakdown of wave c pink. It is not accurately seen on the hourly chart.
Wave (iii) green is just 0.74 points longer than 2.618 the length of wave (i) green.
At 1,210.74 wave (v) green would reach 0.618 the length of wave (iii) green. This is the first target shown on the hourly chart.
At 1,233.62 wave (v) green would reach equality with wave (iii) green. This is part of the second target calculation shown on the hourly chart.
The high of wave (iii) green coincides with the highest reading on MACD. We have continuing divergence with price trending higher and MACD trending lower. This upwards wave should end soon.
We may draw a double wide trend channel about wave c pink. Wave (v) green may end about the mid line of this channel. When the channel is clearly breached by downwards movement this should be the first indication that wave c pink has completed wave A blue, and wave B blue downwards has begun.
Alternate Hourly Wave Count.
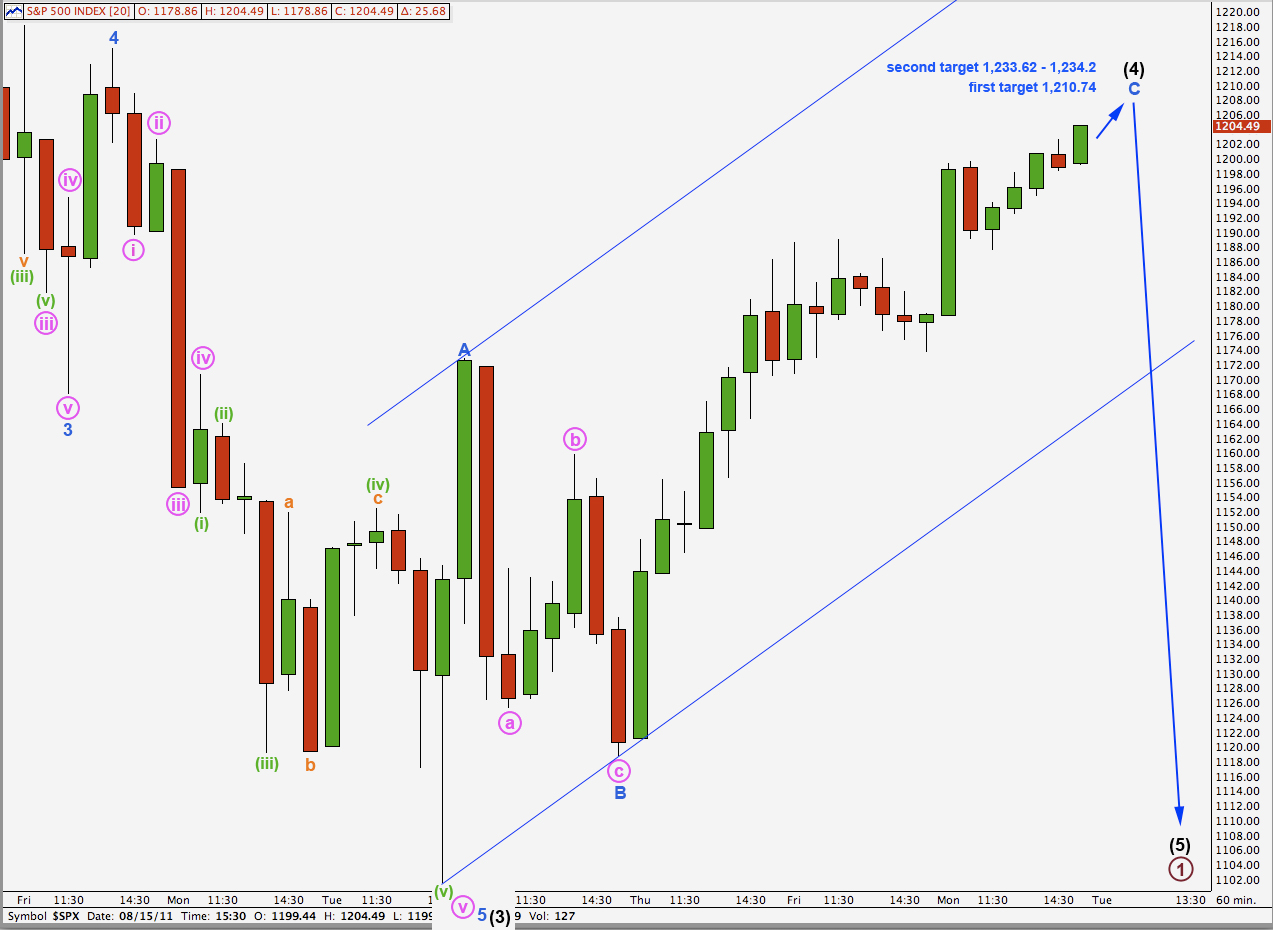
It is also still possible that wave (4) black is nearing completion, but this is less likely than the main hourly wave count above.
If wave (4) black is almost over it is still very brief for an intermediate degree wave, only 5 days so far. It also would not have complete alternation with wave (2) black in structure; both are zigzags.
We will only know that this wave count is correct if the next wave downwards completes as a three wave structure.