
Elliott Wave chart analysis for the S&P 500 for 12th August, 2011. Please click on the charts below to enlarge.
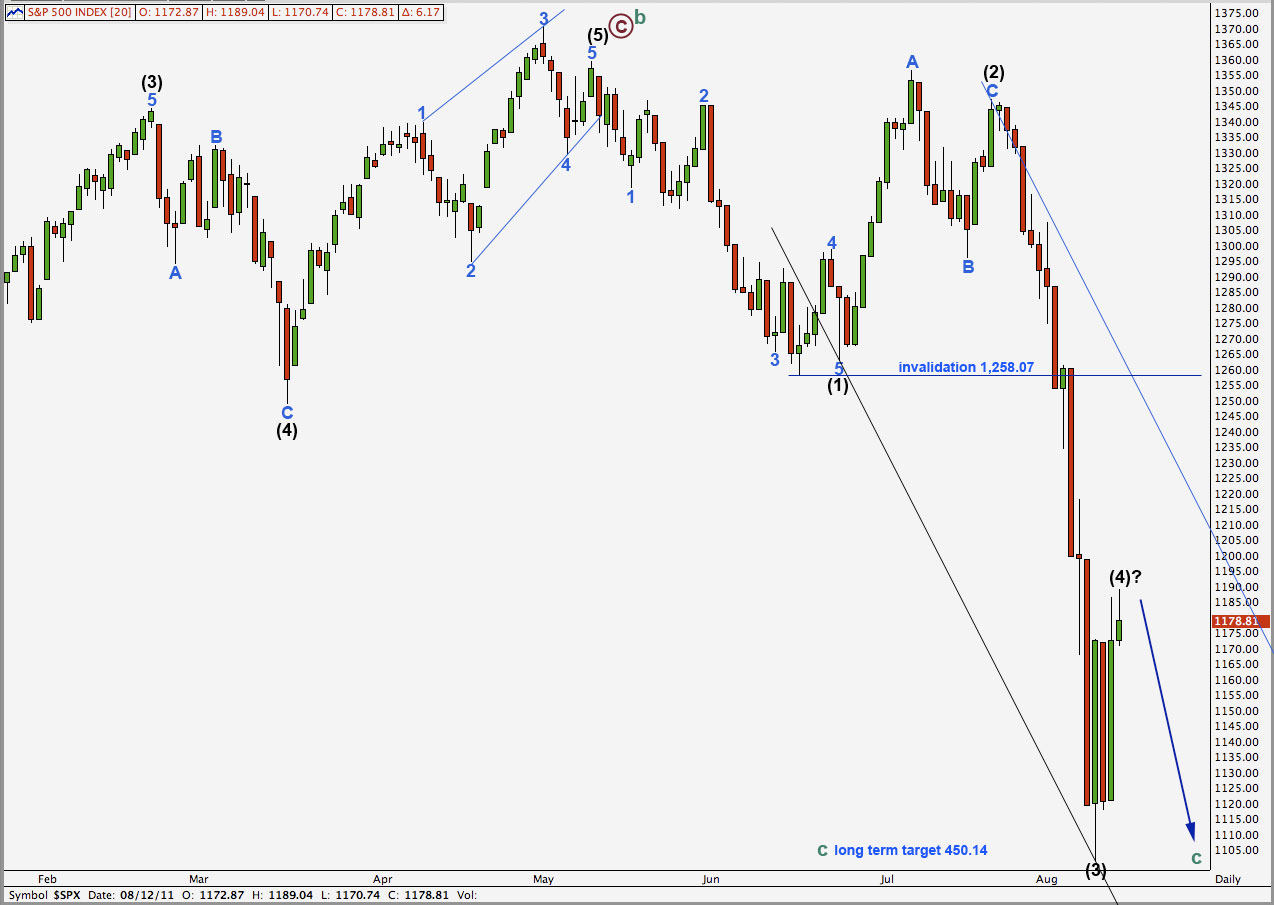
We had expected the S&P to move downwards for Friday but it moved a little higher invalidating the alternate hourly wave count by 2.75 points.
This analysis is essentially the same as last analysis. We will expect downwards movement for Monday’s session and we still have two hourly wave counts.
The main hourly wave count should be favoured because it expects wave (4) black to continue. A fourth wave at intermediate degree would be unlikely to be over in a mere 4 days. We would expect it to last at least another week.
The alternate hourly wave count is less likely because it sees wave (4) black as complete.
The structure of downwards movement will illuminate which wave count is correct.
Further upwards movement for wave (4) black may not move into wave (1) black price territory. This wave count is invalidated with movement above 1,258.07.
Main Hourly Wave Count.
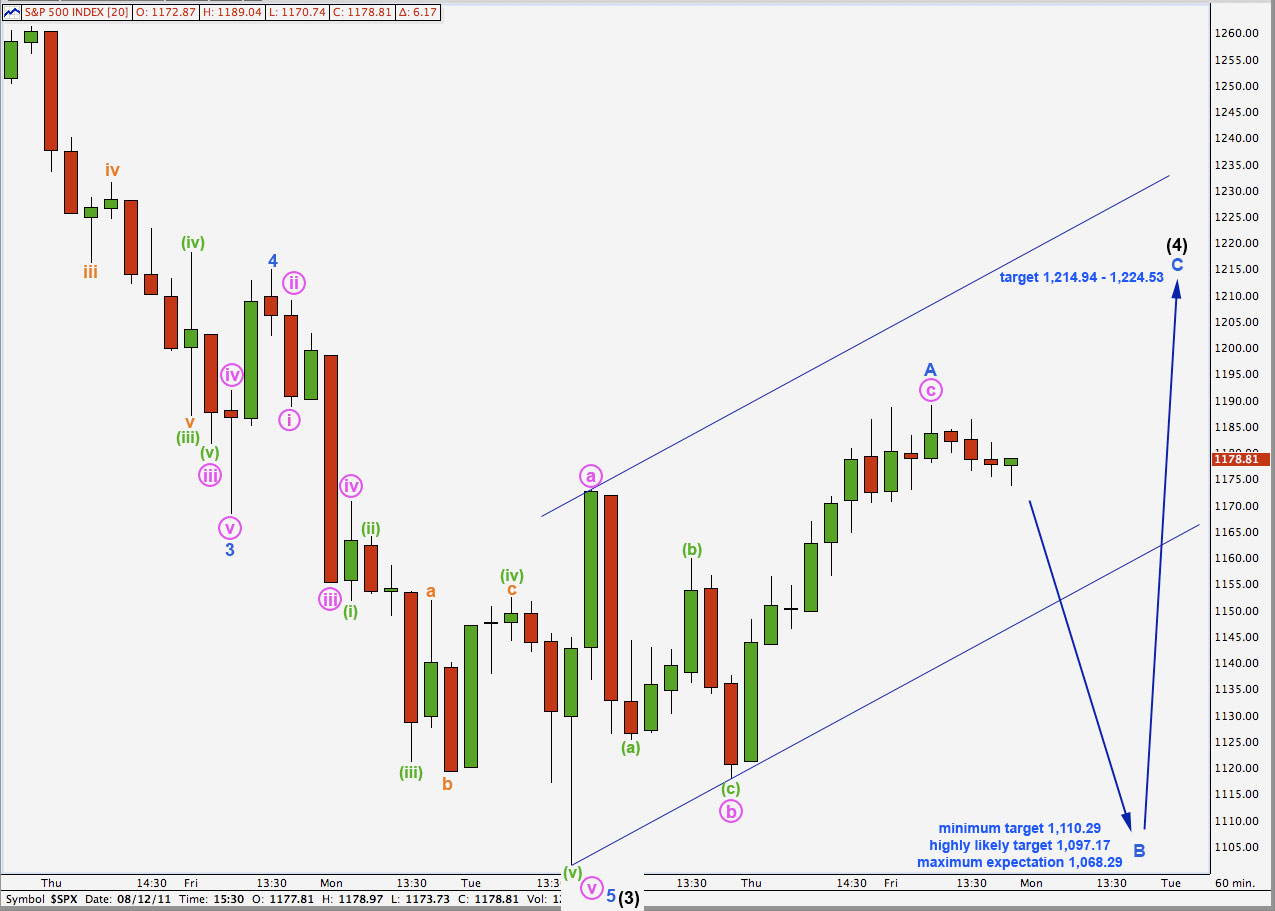
With a little further upwards movement for Friday wave c pink within wave A blue is now almost perfectly equal in length to wave a pink; it is just 0.3 points short of equality.
If wave (4) black is unfolding as a flat correction, which is most likely, then wave B blue must be at least 90% the length of wave A blue. This gives us a minimum target for downwards movement for Monday at 1,110.29.
The most common type of flat is an expanded flat. This requires wave B to be at least 105% the length of wave A blue. It is highly likely that wave B blue will reach at least to 1,097.17.
Wave B of a flat correction is normally not longer than 138% the length of wave A. It is unlikely that wave B will move below 1,068.29.
If wave (4) black is a triangle then there is no minimum length for wave B in relation to wave A blue. I have found a common length of triangle waves is about 80% of each predecessor. This would be achieved about 1,111.78.
The structure of wave B blue is highly likely to be a zigzag, but it may also be a flat or a triangle. If wave B blue is a zigzag then wave b pink within it may not move beyond the start of wave a pink above 1,189.04. However, if wave B blue is a flat correction then wave b pink within it may make a new price high above the start of wave a pink at 1,189.04. This is why for this main wave count there is no short term invalidation point at 1,189.04.
Wave c pink on a 5 minute and 1 minute chart now is exhibiting divergence with MACD: price for Friday trended slightly higher while MACD trended lower. This indicates a more than likely end to wave c pink.
If this wave count is correct and wave b blue is underway then no second wave correction within it may move beyond the start of the first wave. This wave count is invalidated with movement above 1,189.04.
Alternate Hourly Wave Count.
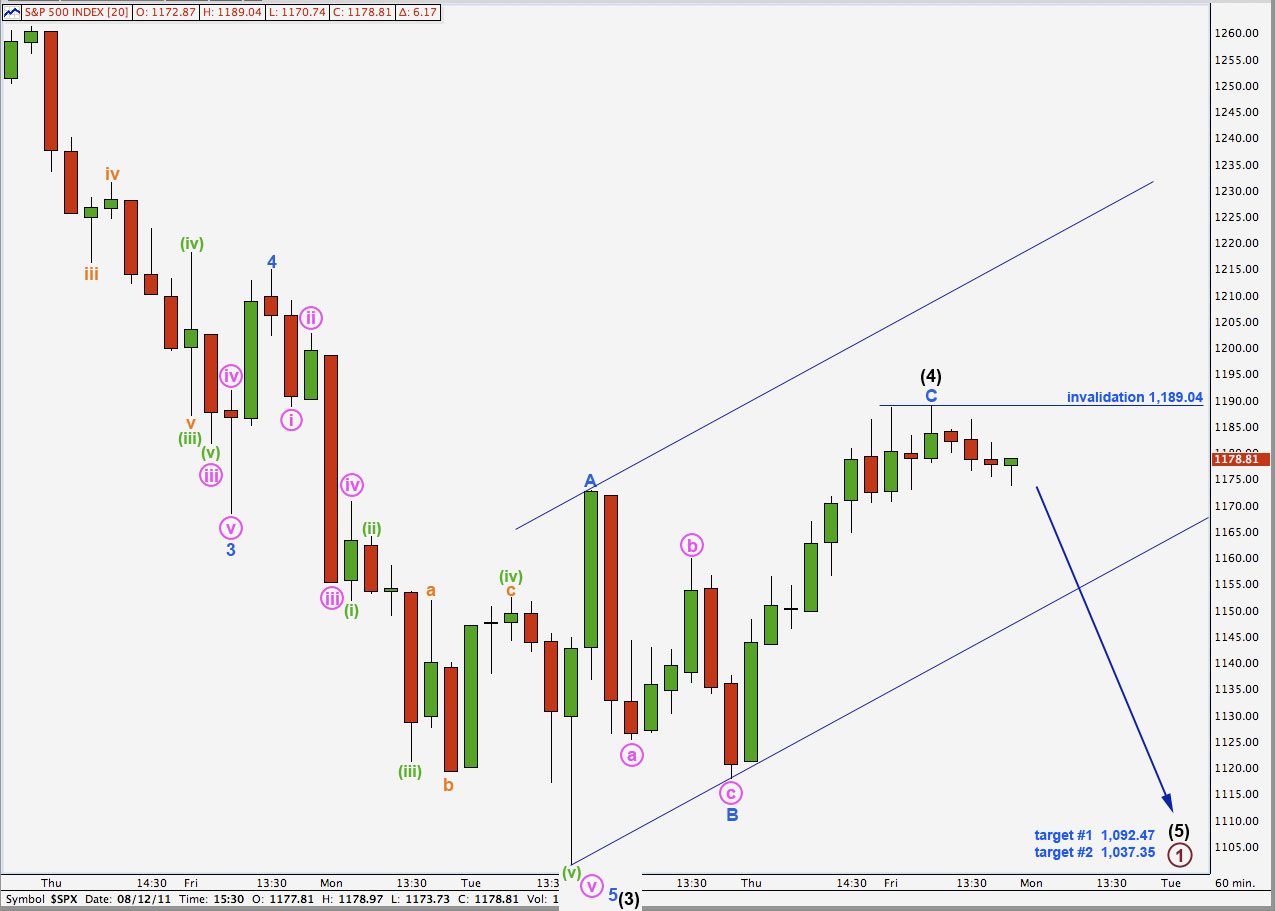
It is possible that wave (4) black is complete as we can now see a complete three wave structure on the hourly chart.
If wave (4) black is over here at 1,189.04 then wave (5) black would reach equality with wave (1) black at 1,092.47. If price keeps falling past this first target then the next likely target is at 1,037.35 where wave (5) black would reach 0.618 the length of wave (3) black.
The upper invalidation point is the same as the main wave count.