
Elliott Wave chart analysis for the S&P 500 for 11th August, 2011. Please click on the charts below to enlarge.
We had expected markets to open with a little downwards movement to our initial target at 1,113.35. This did not happen. We then expected to see price rise again to most likely make new high above Tuesday’s high at 1,172.85 and this did happen.
It is possible that only wave A blue within wave (4) black is over and that this fourth wave will last longer. At this stage this would seem more likely. For this reason this is my main hourly wave count, but I only favour it slightly.
It is also possible that wave (4) black may now be complete, and we must work with alternate wave counts to consider different degrees of labeling. It is possible that wave (4) black may have been a shallow 35% and brief 3 day correction, and this could fit with recent wave behaviour.
Unfortunately, there is no lower price point at which we can confirm one hourly wave count and invalidate the other. The differentiation will come in the structure of this next downwards wave. If it is a three then the main hourly wave count will be correct; if it is a five then the alternate hourly wave count will be correct.
Both hourly wave counts expect downwards movement tomorrow to at least 1,089.72 and so there is no divergence in our expectations for direction tomorrow.
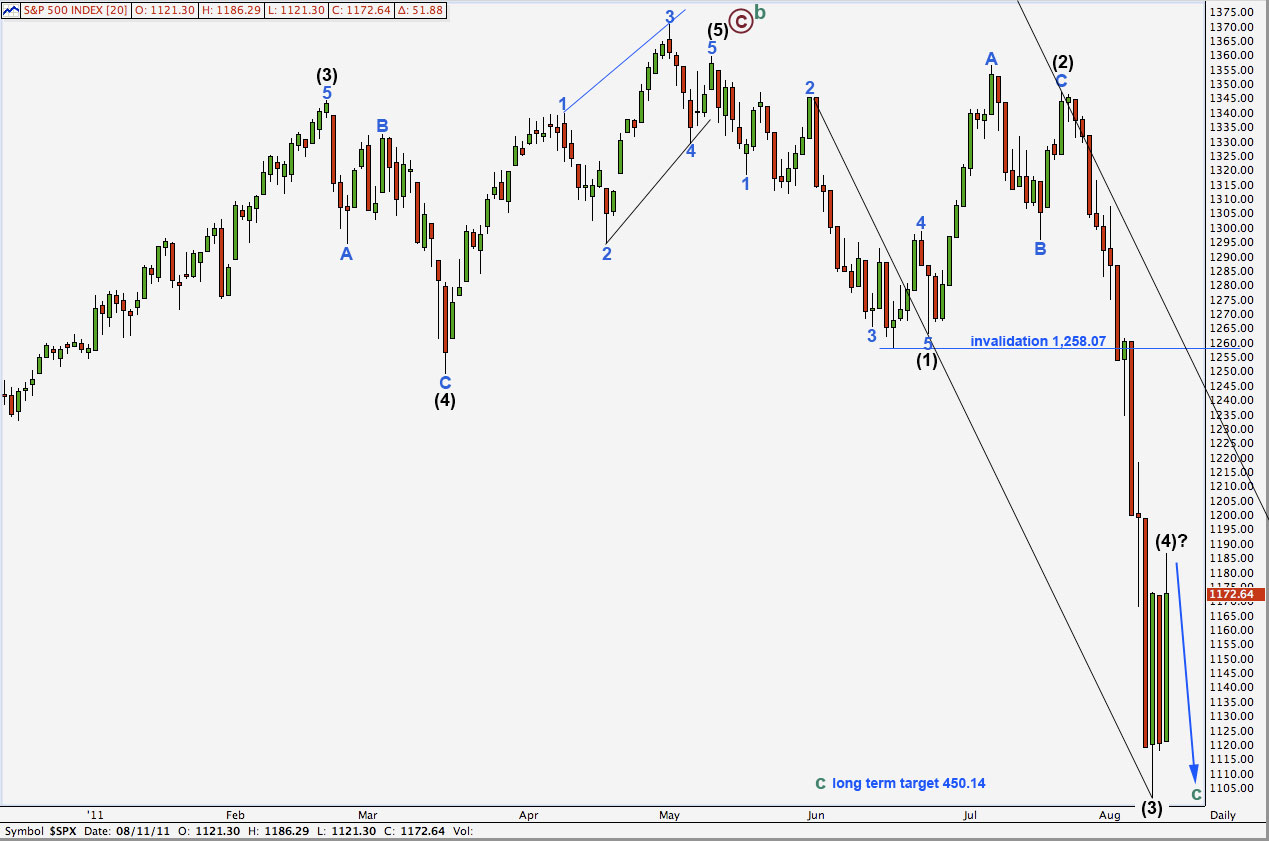
When wave (4) black is complete then wave (5) black downwards would complete primary wave 1 within cycle wave c.
Our long term target remains the same. Cycle wave c would reach equality with cycle wave a at 450.14. This target may be reached in May next year, at the earliest, but most likely later than that.
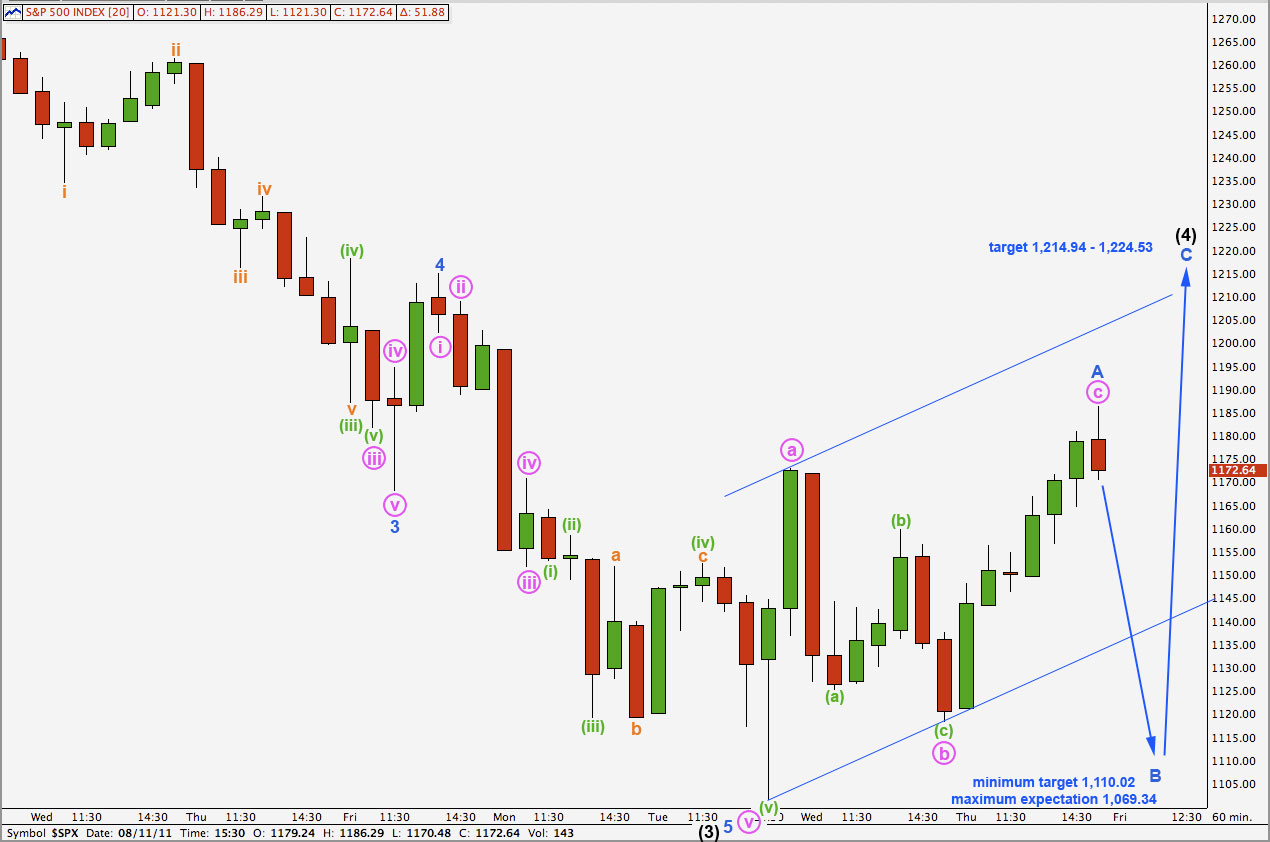
Main Hourly Wave Count.
Both our hourly wave counts expect that the upwards c wave was over on Thursday’s session and that Friday will see downwards movement.
This main hourly wave count is only slightly favoured because we would normally expect an intermediate degree wave to last quite a lot longer than just three days (and this assumes that I have the degree of labeling correct also).
This main hourly wave count sees wave A blue within wave (4) black complete as a simple zigzag. Wave c pink is just 2.24 points short of equality with wave a pink.
With wave A blue subdividing as a three wave structure wave (4) black may be either a flat or a triangle. It is more likely to be a flat because those structures are very common.
A flat correction requires wave B blue to be at least 90% the length of wave A blue. This is achieved at 1,110.02 and so this is our minimum expectation for downwards movement tomorrow.
The most common type of flat is an expanded flat which requires wave B blue to reach 105% the length of A or longer. This would be achieved at 1,097.30.
A flat correction has a maximum common length of wave B in relation to A at 138%. This is achieved at 1,069.34 and so for this main hourly wave count we would not expect price to move much below this point.
In summary, tomorrow we expect downwards movement which is: extremely likely to move at least to 1,110.02, highly likely to move below 1,097.30, but unlikely to move below 1,069.34.
Within a flat correction, the only requirement for the structure of wave B is its length. However, B waves within flats are almost always zigzags, sometimes flats themselves, and rarely triangles.
The other possibility is that wave (4) black may unfold as a triangle. Triangles commonly have wave lengths which are about 80% of each predecessor. This is achieved at 1,118.49. If downwards movement tomorrow is a three, ending about this point and does not reach 1,110.02, then a triangle for wave (4) black would be probable.
When we know where wave B blue has ended we may calculate a more accurate target for wave (4) black to end. At this stage the target will remain from the fourth wave of one lesser degree at 1,214.94 to 50% of wave (3) black at 1,224.53, favouring the lower end of this zone.
Alternate Hourly Wave Count.
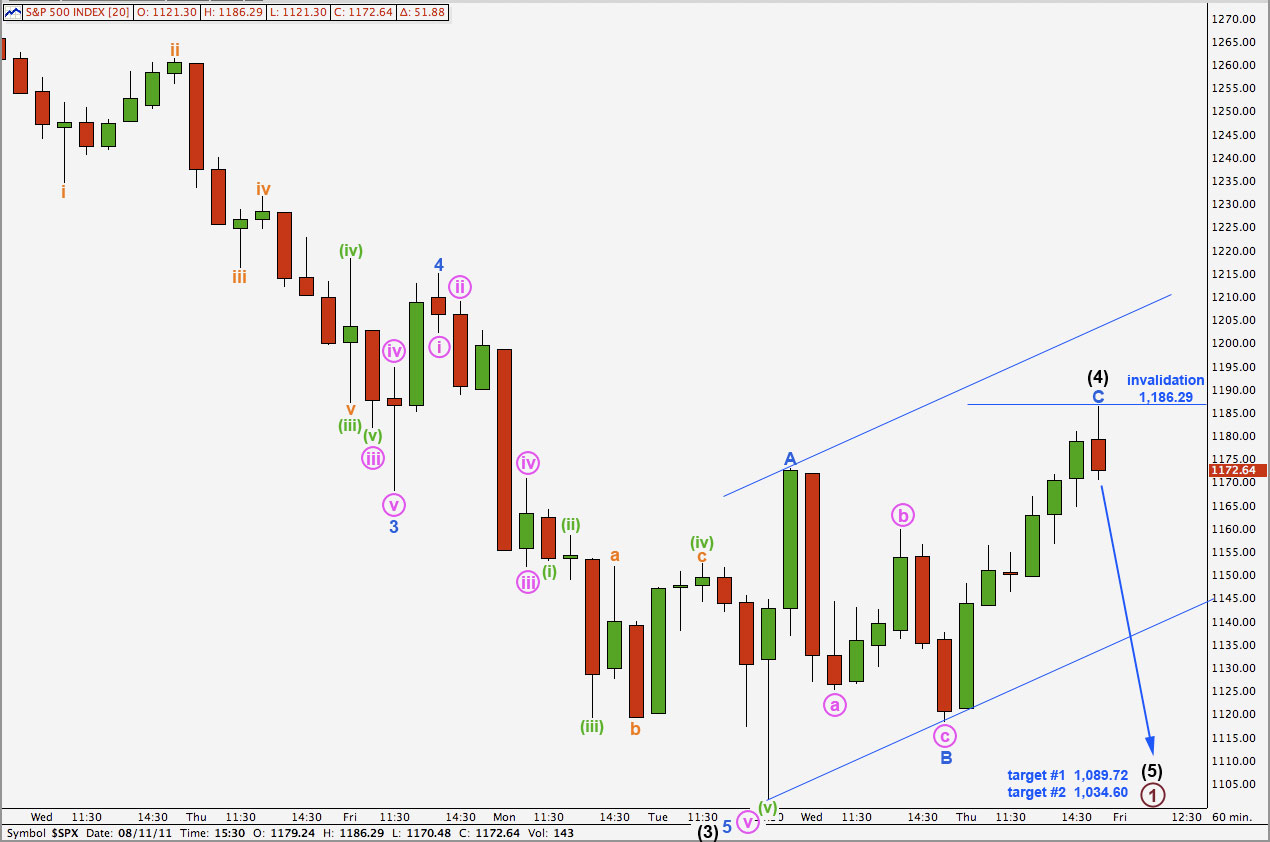
This wave count is (thankfully) a lot simpler than the main hourly wave count above, but somewhat less likely.
Wave (4) black may be complete as a brief shallow zigzag. It would have only lasted three days though, which would be highly unusual for an intermediate degree wave. However, if I have the degree of labeling for all this downwards movement wrong that would make more sense.
We will only know if this wave count is correct if downwards movement tomorrow unfolds as a clear five wave structure, either an impulse or an ending diagonal. If it is a three then this wave count may be eliminated when it is clear that the three down is complete.
If wave (4) black is complete then we may calculate two targets for wave (5) black. The first most likely target at 1,089.72 is simply where wave (5) black would reach equality in length with wave (1) black. The second less likely target is at 1,034.60 where wave (5) black would reach 0.618 the length of wave (3) black.
For this wave count, if wave (4) black is complete, then any movement above 1,186.29 would invalidate this wave count.