
Elliott Wave chart analysis for the S&P 500 for 10th August, 2011. Please click on the charts below to enlarge.
As expected from yesterday’s hourly chart the S&P 500 moved lower yesterday but has remained above our invalidation point at 1,101.54.
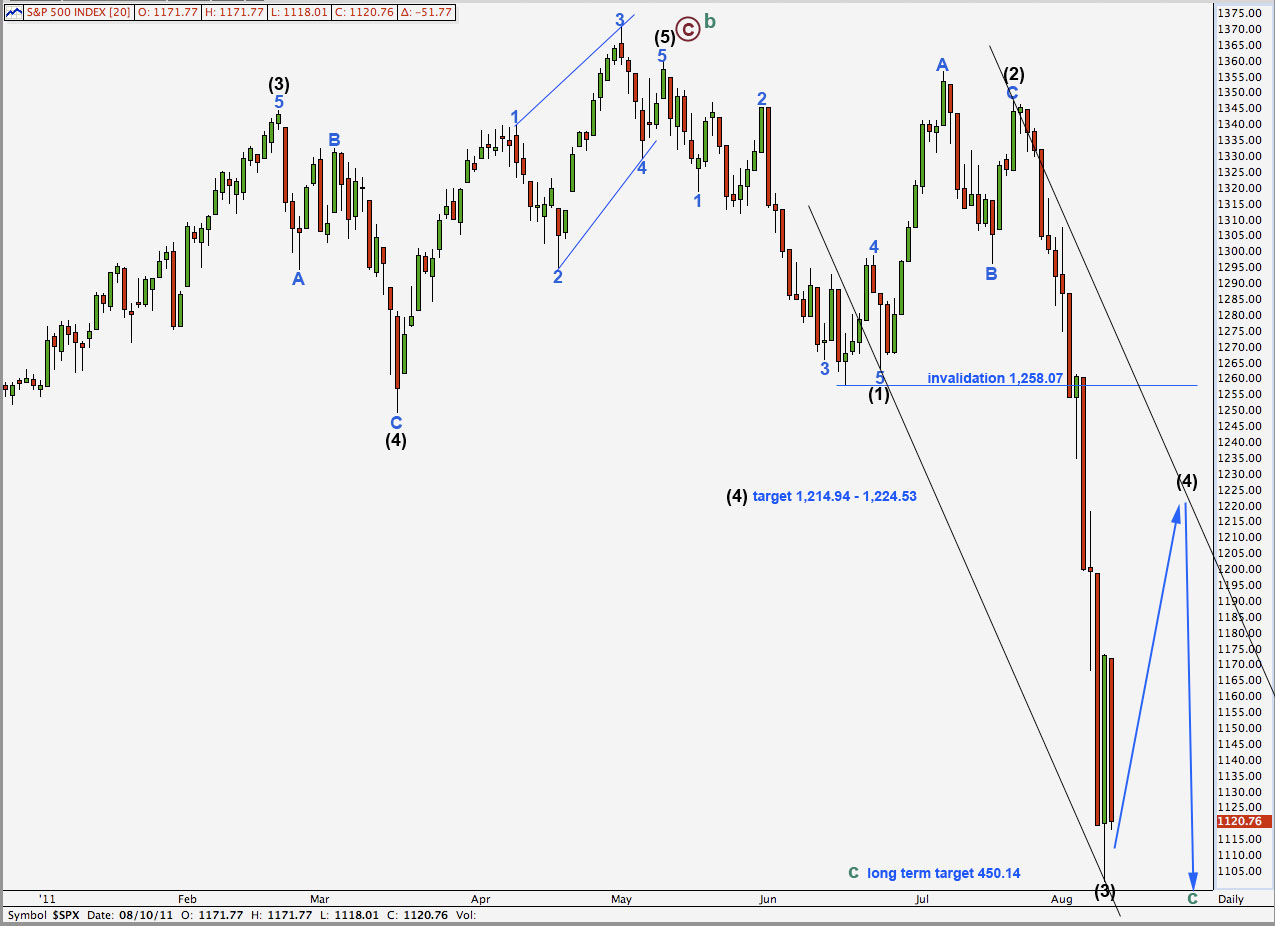
So far wave (4) black is unfolding as expected.
At this stage we may have two hourly wave counts for recent movement. Wave (4) black may have completed waves A and B blue within it of a zigzag or a triangle. This is covered by our main hourly wave count today.
Alternately, only waves a and b pink within wave A blue of wave (4) black may be (almost) complete if wave (4) black is to be a flat correction or a triangle. This is covered by our alternate hourly wave count today.
When wave (4) black is complete then we shall expect further downwards movement most likely to new lows for wave (5) black. We may expect wave (5) black to be either 96.57 points or 152 points in length. This would end primary (maroon) wave 1 within cycle wave c downwards.
The long term target remains the same. Cycle wave c would reach equality in length with cycle wave a at 450.14. To see how this fits into the larger picture please see the S&P 500 Historical Analysis.
Wave (4) black may not move into wave (1) black price territory. This wave count is invalidated with movement above 1,258.07.
Main Hourly Wave Count.
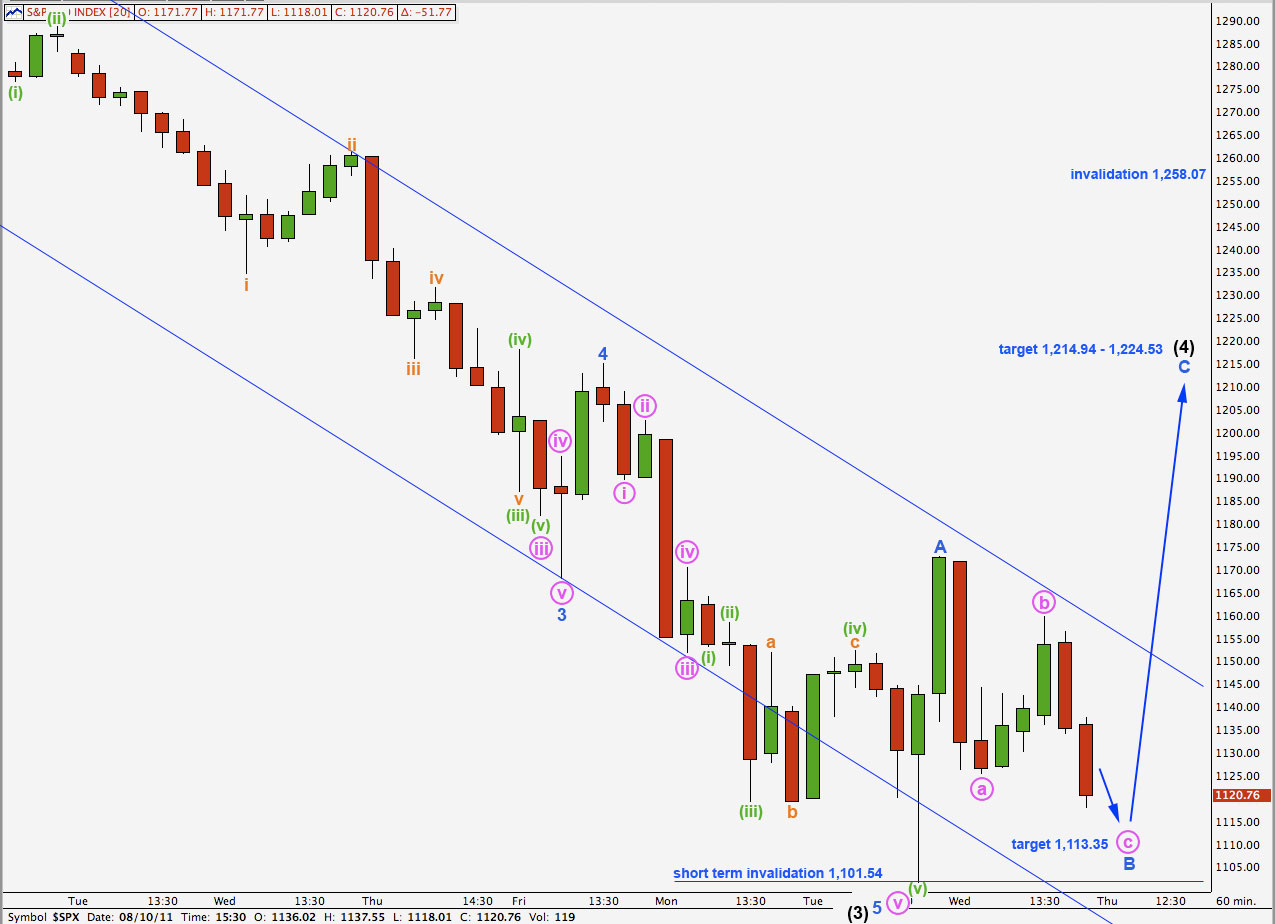
Wave A blue was complete at 1,172.85 at market close on 9th August. Wave B blue has moved price lower during Wednesday’s session in an obvious three wave structure.
Within wave B blue wave c pink is unlikely to be over. There is no divergence with MACD and price both trending lower. I can see an impulsive wave count on the 1 minute chart for this wave, but without divergence I hesitate to call it complete. Wave c pink is likely to reach equality with wave a pink about 1,113.35.
If this call is wrong and wave c pink is over then we would know for certain this is the case only when price moves above 1,159.78 at its start.
When wave c pink completes the zigzag for wave B blue then price should turn back upwards for a five wave structure for wave C blue. This should bring price out of the parallel channel containing wave (3) black downwards which would further confirm our wave count.
When we know where wave B blue has ended we may calculate a target for wave C blue upwards.
Wave B blue may not move beyond the start of wave A blue. This wave count is invalidated with movement below 1,101.54.
If this wave count is invalidated by movement below 1,101.54 tomorrow then there is a very small possibility that wave (4) black may be unfolding as a running triangle where wave A was a five wave structure. This is the only corrective pattern which allows for wave B to make a new price extreme beyond the start of A when A may subdivide into a five. Due to the very low probability of this structure I will not chart this possibility for us, but we should be aware that it exists. In this instance the probability is reduced because wave A was a five and within a triangle it is most likely to be a three.
Alternate Hourly Wave Count.
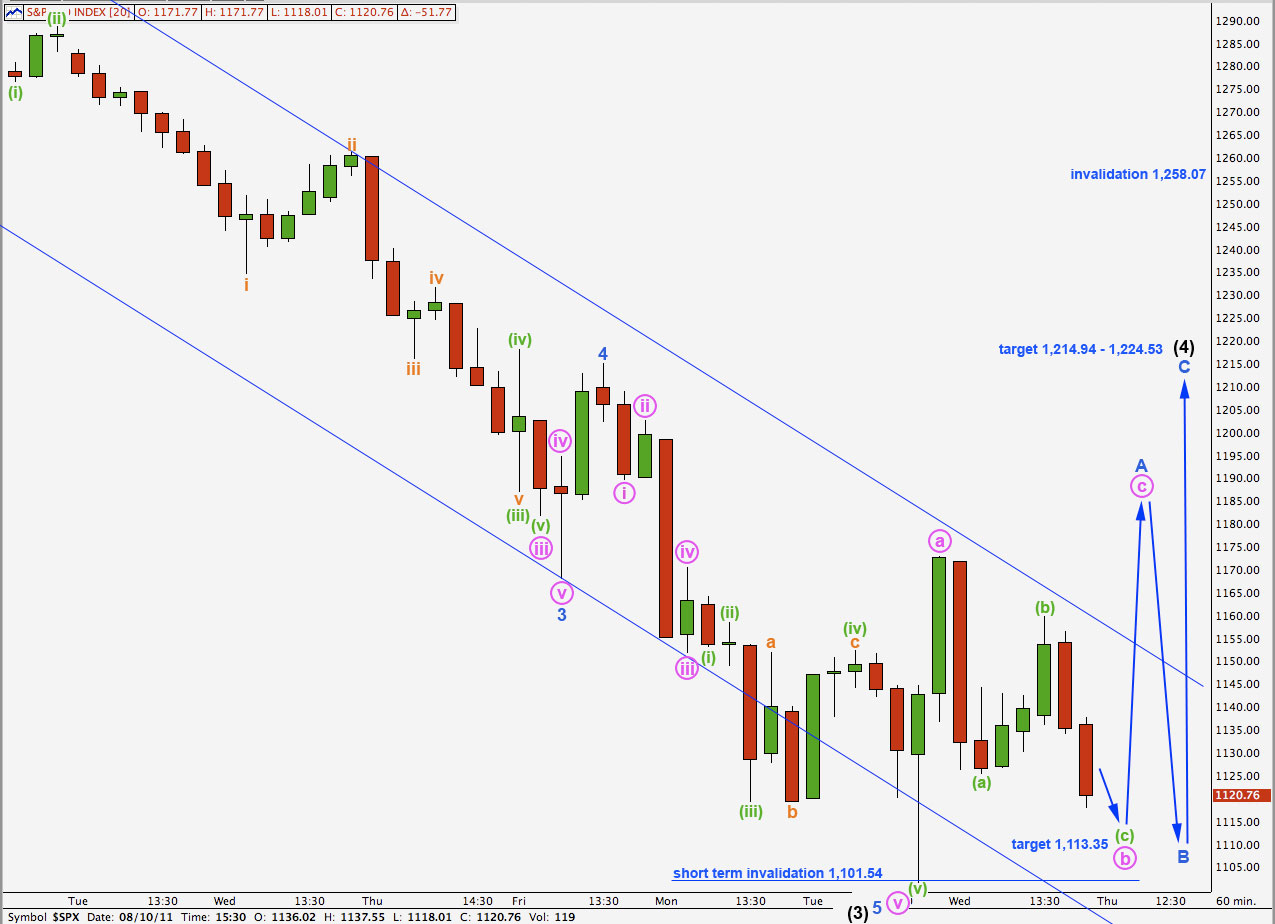
This alternate wave count differs only from our main hourly wave count in the degree of labeling for the last two days.
This alternate wave count would expect a longer lasting fourth wave correction which may take a week or two. This is fairly likely.
The subdivisions are the same, the target for downwards movement tomorrow is the same, and the short term invalidation points are the same.
This alternate excludes the possibility of a new low below 1,101.54 tomorrow because wave A blue may not be a triangle.