
Elliott Wave chart analysis for the S&P 500 for 9th August, 2011. Please click on the charts below to enlarge.
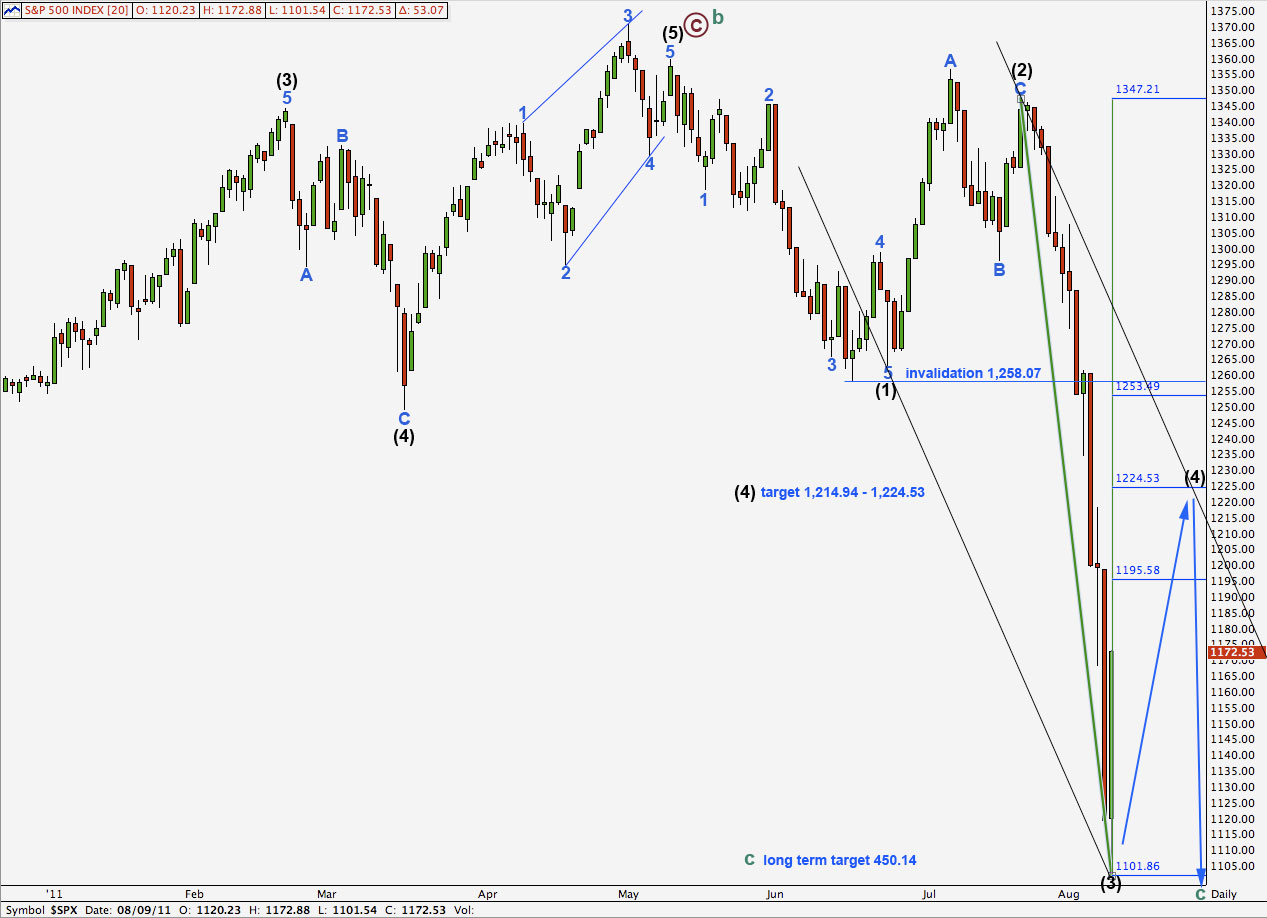
I have moved the degree of labeling for downwards movement all up one degree. Cycle wave c must subdivide into a five wave structure at primary (maroon) degree. We are still within primary wave 1 and within that we have an end to black (intermediate) waves (1), (2), and (3).
Tuesday began with unexpected upwards movement which invalidated our hourly wave count by 0.52 points. Thereafter, price turned downwards to end just within the lower end of our target zone for wave (3) black to end. This strong third wave is very likely to be over as we expected and the fourth wave bounce is here.
Wave (3) black is just 7.36 points short of 2.618 the length of wave (1) black.
The most likely place for wave (4) black to end would be about the fourth wave of one lesser degree. Wave 4 blue ends at 1,214.94. This is fairly close to the 0.5 ratio of wave (1) black at 1,224.53 giving us a 9.59 point target zone.
The analysis of wave (3) black downwards was very good as impulses are relatively easy to analyse. Once it was confirmed that it was a third wave then we knew that it could only be an impulse structure because third waves can only subdivide into impulses.
At this stage this is where the analysis gets a lot more difficult. There are 13 possible corrective structures. At this early stage we cannot eliminate any of these possible structures for wave (4) black.
Because wave (2) black was a zigzag (with a truncated C wave) and was a deep correction, the guideline of alternation tells us to expect wave (4) black to more likely be a flat or triangle, and a shallow correction.
The lower end of our target zone should be favoured.
Wave (4) black may not move into the price territory of wave (1) black. This wave count is invalidated with movement above 1,258.07*.
(*Yesterday’s analysis included an error: the invalidation point was incorrectly stated as the end of wave (1) and not the price extreme.)
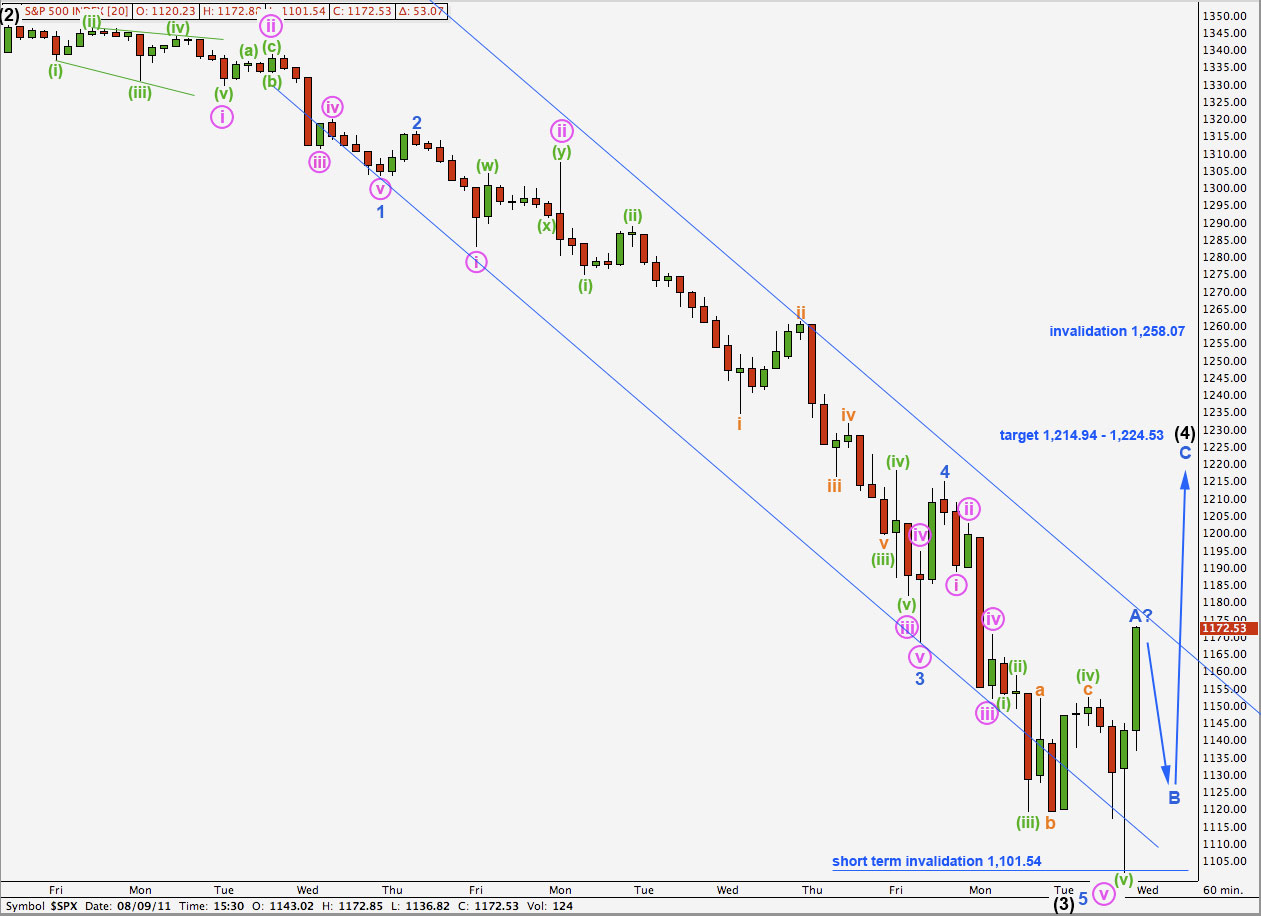
It seemed a reasonable assumption to make yesterday that wave (iv) green within wave v pink to end wave 5 blue was a complete zigzag. However, that was only wave a within wave (iv) green. Wave (iv) green continued sideways as a regular flat correction which still remained slightly below the price territory of wave (i) green at 1,152.46 (this figure is taken from the 5 minute chart).
Wave (iv) green is now out of proportion to wave (ii) green but that is okay. These are low wave degrees (below minor) on the hourly chart and we cannot always expect them to be nicely in proportion.
Ratios within wave (3) black are: wave 3 blue has no Fibonacci ratio to wave 1 blue and wave 5 blue is just 0.51 points short of 2.618 the length of wave 1 blue.
Within wave 5 blue of wave (3) black there are no adequate Fibonacci ratios between waves i, iii, and v pink.
Ratios within wave v pink of wave 5 blue of wave (3) black are: wave (iii) green has no Fibonacci ratio to wave (i) green and wave (v) green is 3.54 points longer than 2.618 the length of wave (i) green.
Wave A blue on the 5 minute chart looks so far like a five wave impulse. It may have ended the final fifth wave at the close of Tuesday’s session, or it may continue yet a little higher.
If price turns downwards when New York opens tomorrow then wave A blue will be most easily seen as a five.
Alternately, this may be wave a pink within wave A blue .
In the short term if this upwards wave remains a five wave impulse on the 5 minute and 15 minute chart, and does not develop into a three, then we should not see a new low below 1,101.54 tomorrow because wave B may not move beyond A within a zigzag.
In the next few days we will have to make a judgement call on which degree to label this movement as wave A blue within wave (4) black unfolds. We will most probably use alternate wave counts for the various possibilities.