
Elliott Wave chart analysis for the S&P 500 for 8th August, 2011. Please click on the charts below to enlarge.
Again, the S&P has continued lower. We expected a little upwards movement to finish a small correction before price continued lower yesterday and we did not get this. Our target for last analysis has not yet been reached and now with more wave structure to analyse this target has been refined.
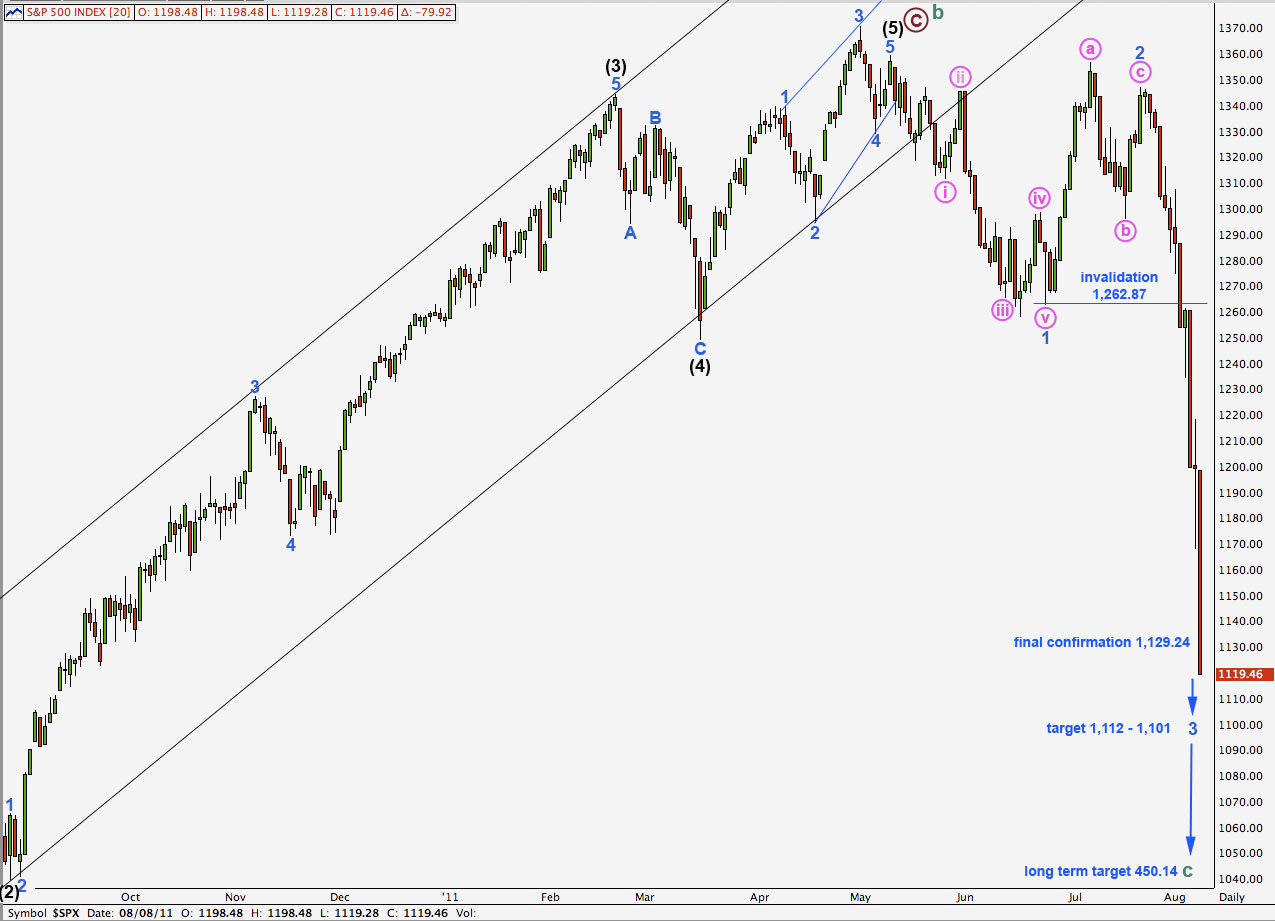
Price has moved below the final confirmation point. There can be no doubt at this stage that the upwards trend has changed. The S&P is on its way to new lows below 666.
Our target for this bear market to end remains at 450.14. The earliest possible date for cycle wave c to reasonably end is May 2012. It may take longer than this. October 2012 would see cycle wave c reach equality with cycle wave a in duration.
There is no downwards invalidation point for this wave count; there is no downwards limit to this bear market.
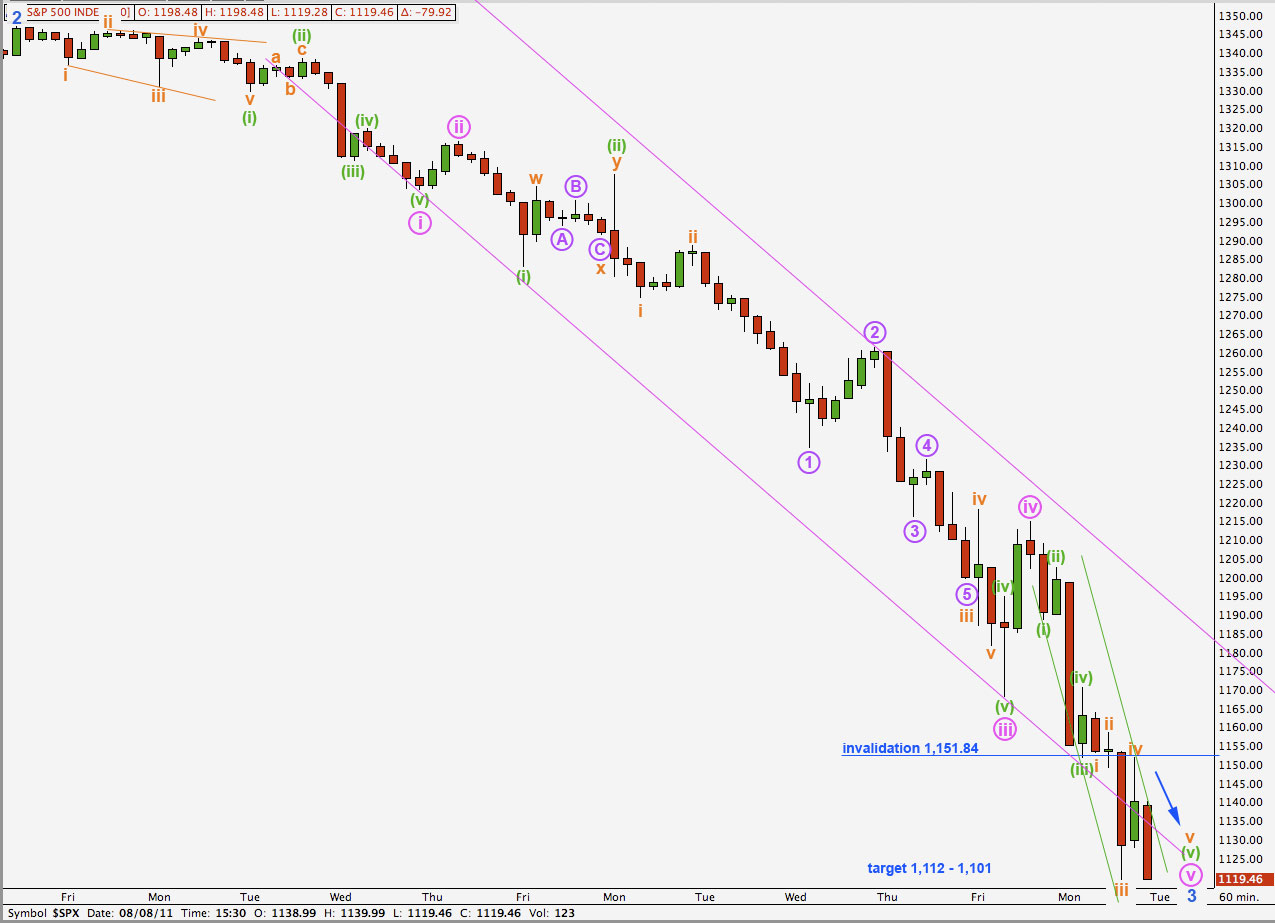
My analysis of the small correction for pink (minute) wave iv was wrong and it did not move any higher. It was over at 1,214.94.
However, my analysis of expecting further significant downwards movement yesterday was correct.
Pink wave iii has no Fibonacci ratio to pink wave i. This means it is more likely that pink wave v will exhibit a ratio to either of iii or i. At 1,101.03 pink wave v would reach 2.618 the length of pink wave i. It has already passed 1.618 the length of pink wave i.
Within pink wave v the labeling has been determined after careful analysis of the 5 minute and 1 minute charts. The 5 minute chart is provided below.

The 5 minute chart above shows all of pink (minute) wave v.
Green wave (iii) has no Fibonacci ratio to green wave (i). This means that is more likely that green wave (v) will exhibit a ratio to either of (i) or (iii). At 1,112.49 green wave (v) would reach equality with green wave (iii).
Within green wave (v) this labeling has been determined after analysis of the 1 minute chart.
Within green wave (v) there is no Fibonacci ratio between orange waves iii and i. This means it is more likely that orange wave v will exhibit a ratio to either of i or iii. If it was to only reach equality with orange i or 0.618 the length of iii it would be truncated, which is unlikely. At 1,112.61 orange wave v would reach equality with orange wave iii.
This gives us a target zone of 1,101.03 to 1,112.49.
About this point wave 3 blue may end and the S&P is likely to enter a larger fourth wave correction which should last a week or two. We may expect wave 4 blue to be a shallow time consuming sideways movement; a flat or triangle is most likely. It will signal the end of this free fall, for the time being. There will be more to come!
This wave count agrees with MACD. For the first time in over a week or so we have a little divergence whne price for Monday trended down and MACD trended up.