
Elliott Wave chart analysis for the S&P 500 for 5th August, 2011. Please click on the charts below to enlarge.
Again, as expected, we saw further downwards movement for Friday’s session. We may have seen the start of a slightly larger correction, but the end of wave 3 blue is still not here.
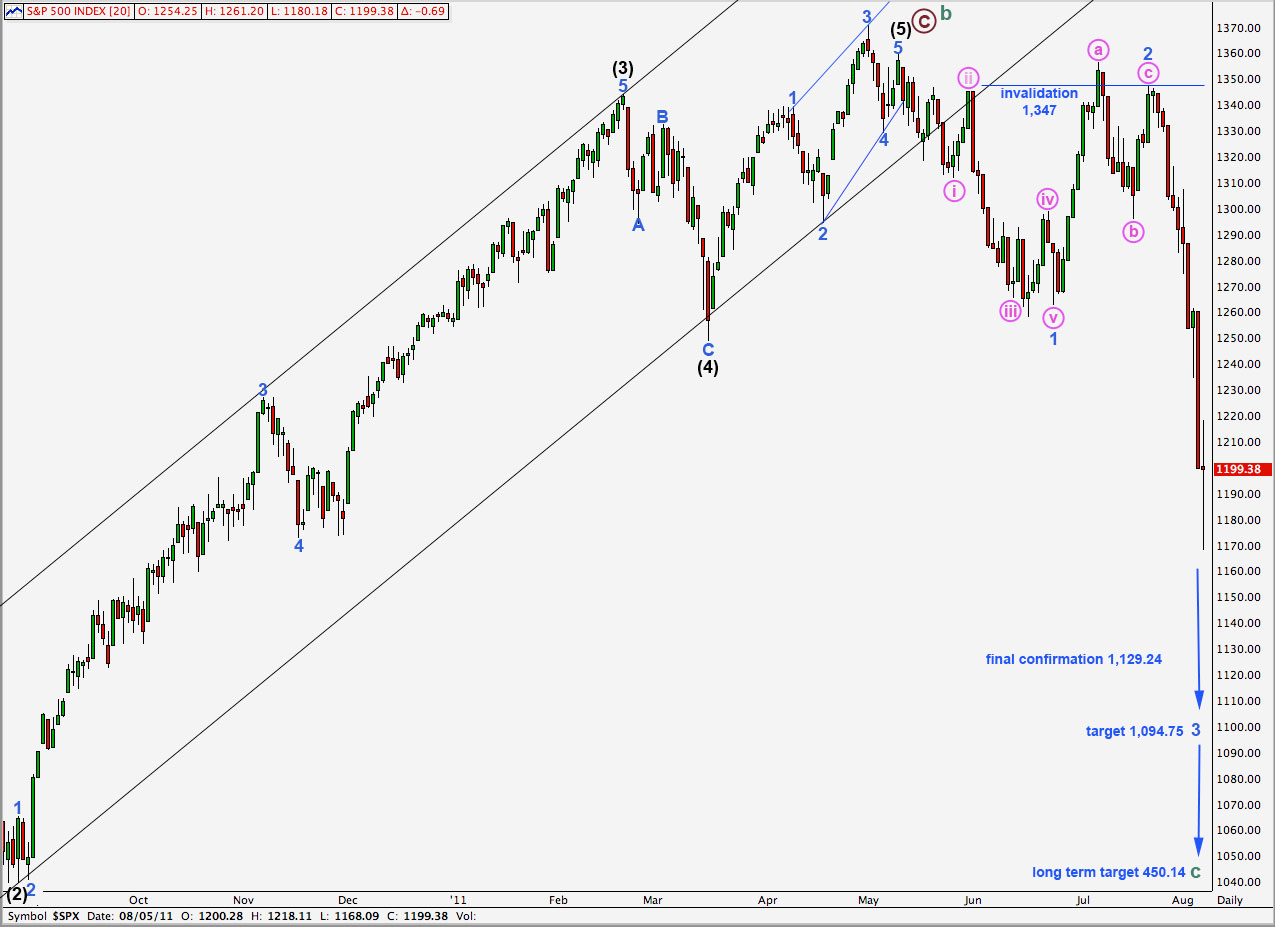
Movement last week is exactly what we were expecting to see for this wave count. Third waves are powerful movements. Wave behaviour nicely confirms our wave count. The possibility of new highs is eliminated. This movement breaches the trend channel containing cycle wave b on the weekly chart confirming a trend change at cycle degree.
Cycle wave c is most likely to make a new low below the end of cycle wave a at 666.79, otherwise it would be truncated. It is most likely to reach equality in length with cycle wave a at 450.14. Cycle wave c should last at least a year if not longer. It began in May 2011 and the earliest it could end may be May 2012. What is more likely is that it would last longer than a year. Cycle wave a lasted 17 months. If cycle wave c is equal in duration with cycle wave a it would end October 2012.
Looking at how far the S&P has come down last week on the weekly chart I may look at moving the degree of labeling up one degree in coming weeks; we may have seen intermediate wave 1 and 2 complete, and intermediate wave 3 may be underway currently. This would all be within primary wave 1.
Cycle wave c must subdivide at primary degree into a five wave structure.
Within wave 3 blue no second wave correction may move beyond the start of its first wave. This wave count is invalidated with movement above 1,347.
I have played around with several different ways to label this downwards wave and this is the best fit I can see. It is not the only possible wave count, but it is the only one I can see which agrees with MACD. The low for Friday has the lowest reading on MACD and there is no divergence on any time frame. For that reason I have discarded a possible wave count which saw wave 3 blue as complete at Friday’s low because if that were the case we would expect to see some divergence towards the end of it for wave v pink.
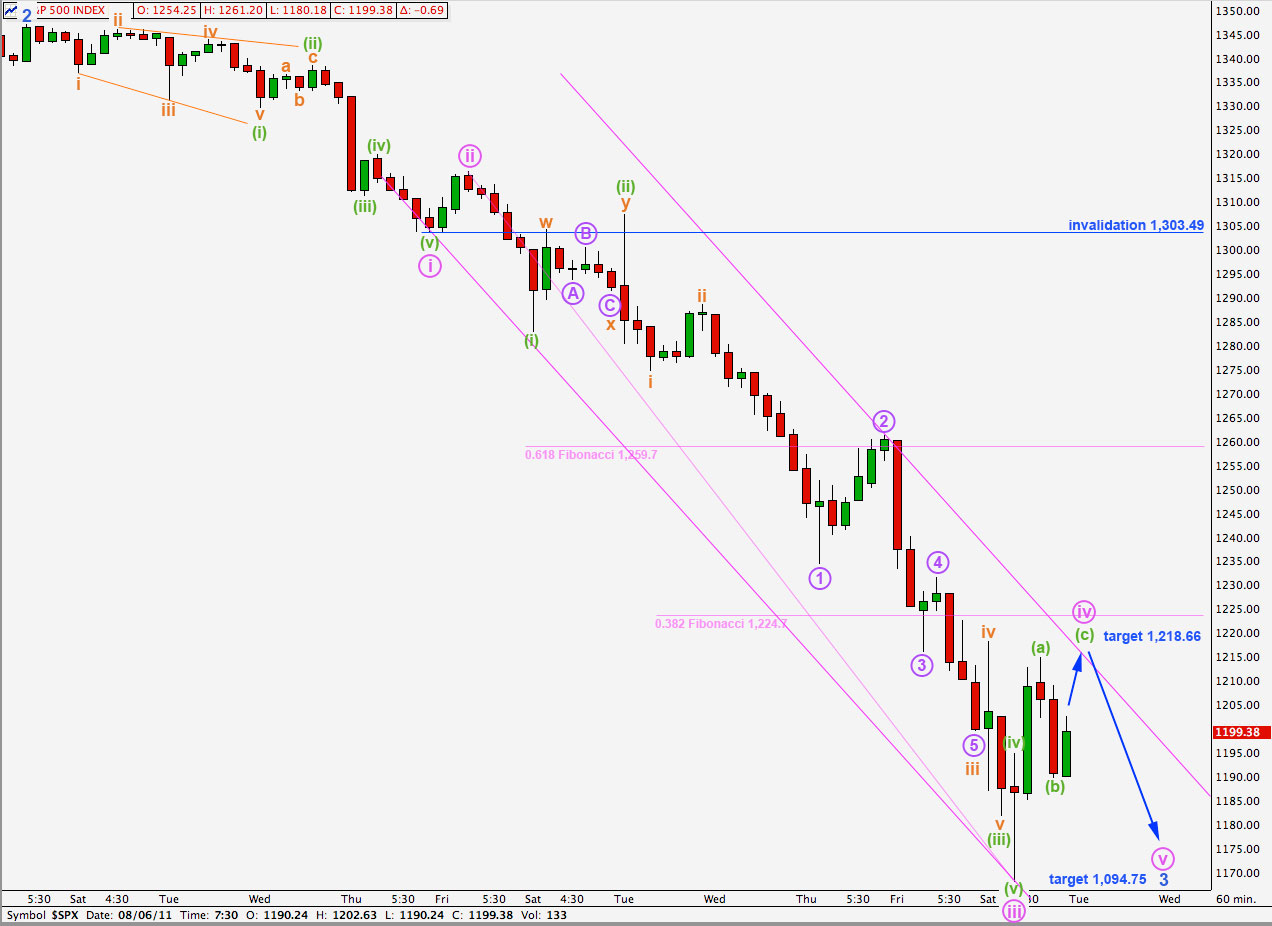
Last analysis expected further downwards movement for wave iii pink to a target about 1,140 to 1,132. With the overlapping seen on a 15 minute chart towards the end of Friday’s session I do not think that wave iii pink has further down to go. This overlapping can only be seen as a series of fourth and fifth waves.
Wave iii pink has no Fibonacci ratio to wave i pink. This means that wave v pink is more likely to have a ratio to either of i or iii pink.
Ratios within wave iii pink are: wave (ii) green has no Fibonacci ratio to wave (i) green and wave (v) green is 3 points short of 0.236 the length of wave (iii) green.
Ratios within wave (iii) green of wave iii pink are: wave iii orange is 3.6 points longer than 2.618 the length of wave i orange and wave v orange is 3.63 points longer than equality with wave i orange.
Ratios within wave iii orange of wave (iii) green of wave iii pink are: wave 3 purple has no Fibonacci ratio to wave 1 purple and wave 5 purple is 1.42 points short of 0.618 the length of wave 1 purple.
Within wave iv pink wave (a) green is a 5 wave impulse when viewed on the 5 and 1 minute chart. Wave (b) green is a three wave zigzag and a 54% correction of wave (a) green.
At 1,218.66 wave (c) green would reach 0.618 the length of wave (a) green. This would bring price close to the upper edge of the trend channel drawn about wave wave 3 blue.
This channel is not strictly Elliott’s technique as the upper trend line is a best fit.
Wave iv pink may not move into wave i pink price territory. This wave count is invalidated with movement above 1,303.49.