
Elliott Wave chart analysis for the S&P 500 for 4th August, 2011. Please click on the charts below to enlarge.
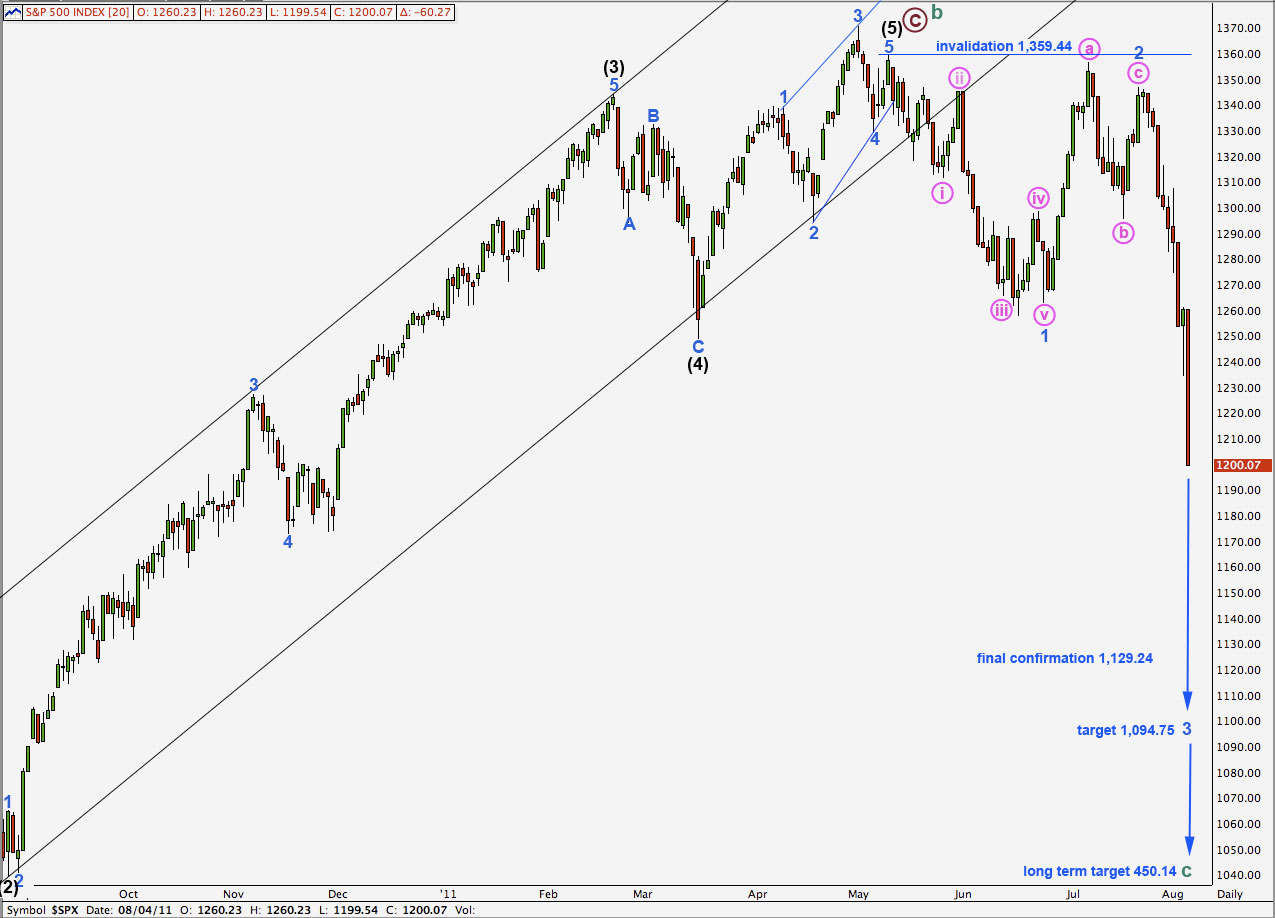
Downwards movement is continuing this third wave down. Wave behaviour is exactly what we should expect from a third wave. It is unlikely to be over yet as there is no divergence with price and MACD. I have revised the target for wave 3 blue downwards.
We may want to move the degree of labeling down one degree if wave 3 blue does reach our new target. At 1.094.18 wave 3 blue will reach 1.618 the length of wave 1 blue. This target is approaching a little faster than I anticipated. It may be reached about the end of next week or shortly after.
The invalidation point at 1,347 expects no second wave correction within wave 3 blue to move beyond the start of its first wave.
When price eventually moves below 1,129.24 that will be full and final confirmation that the S&P is in a bear market to make new lows and which should last at least a year if not longer (from the start in February 2011).
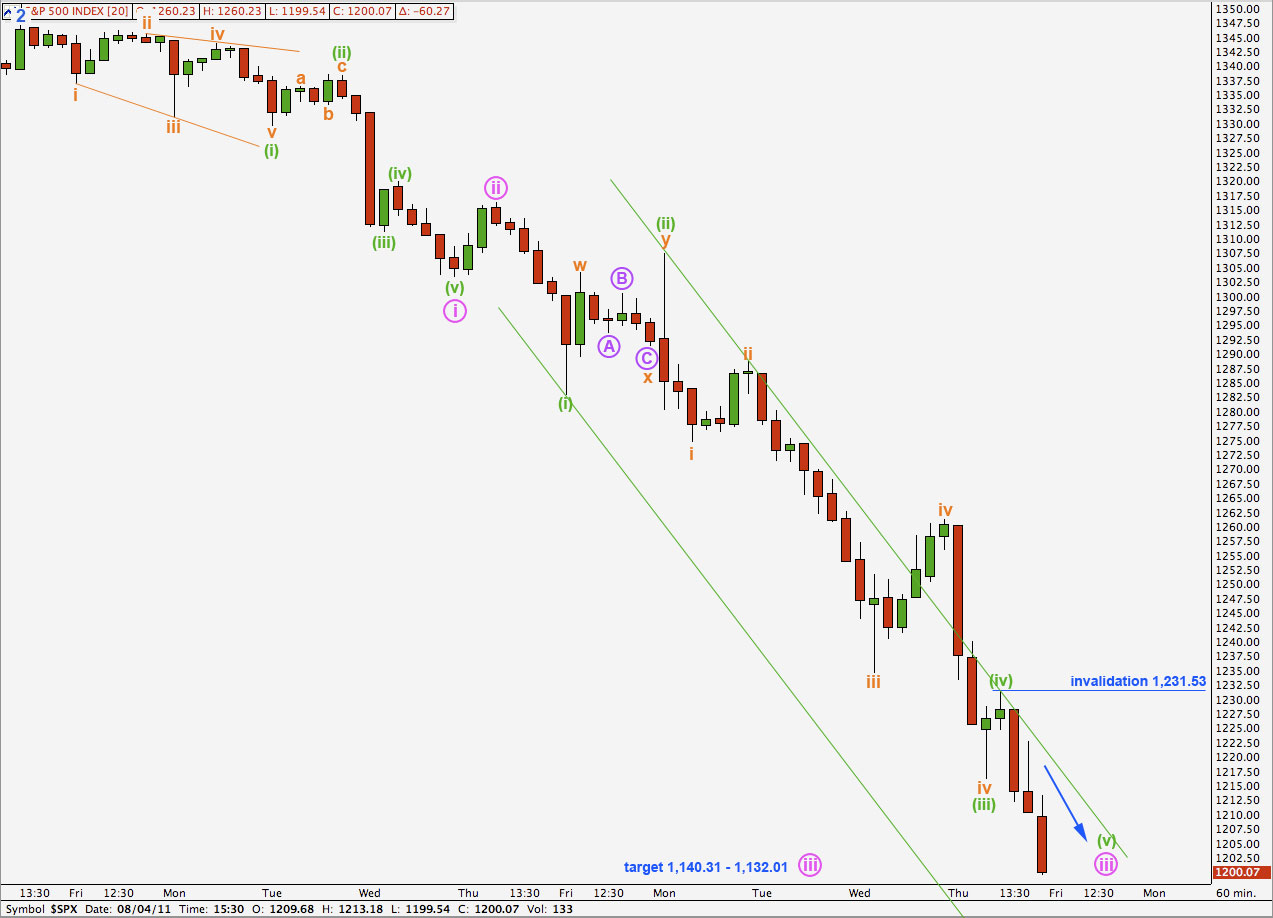
I had expected Thursday to open with a very little upwards movement but this did not happen. My analysis on the 5 minute chart of wave iv orange within wave (iii) green was incorrect and it was over at 1,261.20.
With downwards movement continuing to exhibit strong momentum, and no divergence at all yet with MACD, we should expect it to keep going for a while yet before a correction of any reasonable size.
I have revised targets downwards again.
Wave (v) green is already just below where our target for wave iii pink was at 1,202.41 but it does not look complete here.
At 1,132.01 wave iii pink would reach 4.236 the length of wave i pink. This is a less common Fibonacci ratio, but it is mathematically correct.
This is reasonably close to where wave (v) green within wave iii pink would reach equality with wave iii green at 1,140.31. This gives us an 8.3 point target zone.
Wave ii pink was a very shallow correction. We may expect the upcoming wave iv pink to be a deeper correction. Wave iv pink may exhibit alternation with wave ii pink in either depth, or structure, or possibly both. If it is a shallow correction it may be a flat or a triangle. If it is a deep correction it may be a zigzag. It should be over within one session, or not much longer.
This analysis over the next few days will be focussed on finding the end of wave 3 blue. The next wave 4 blue should last at least a week if not longer, and is likely to be shallow.
I have used Elliott’s second technique to construct the trend channel about wave iii pink. It may end either midway in the channel or possibly at the lower edge.
When we can see at least one full hourly candlestick above the channel an not touching it then we shall have trend channel confirmation of a trend change. At that stage wave iv pink should be underway.
Within wave (v) green no second wave correction may move beyond the start of its first wave. This wave count is invalidated with movement above 1,231.53.
If this wave count is invalidated with upwards movement then we may use the alternate below.
Alternate Wave Count.
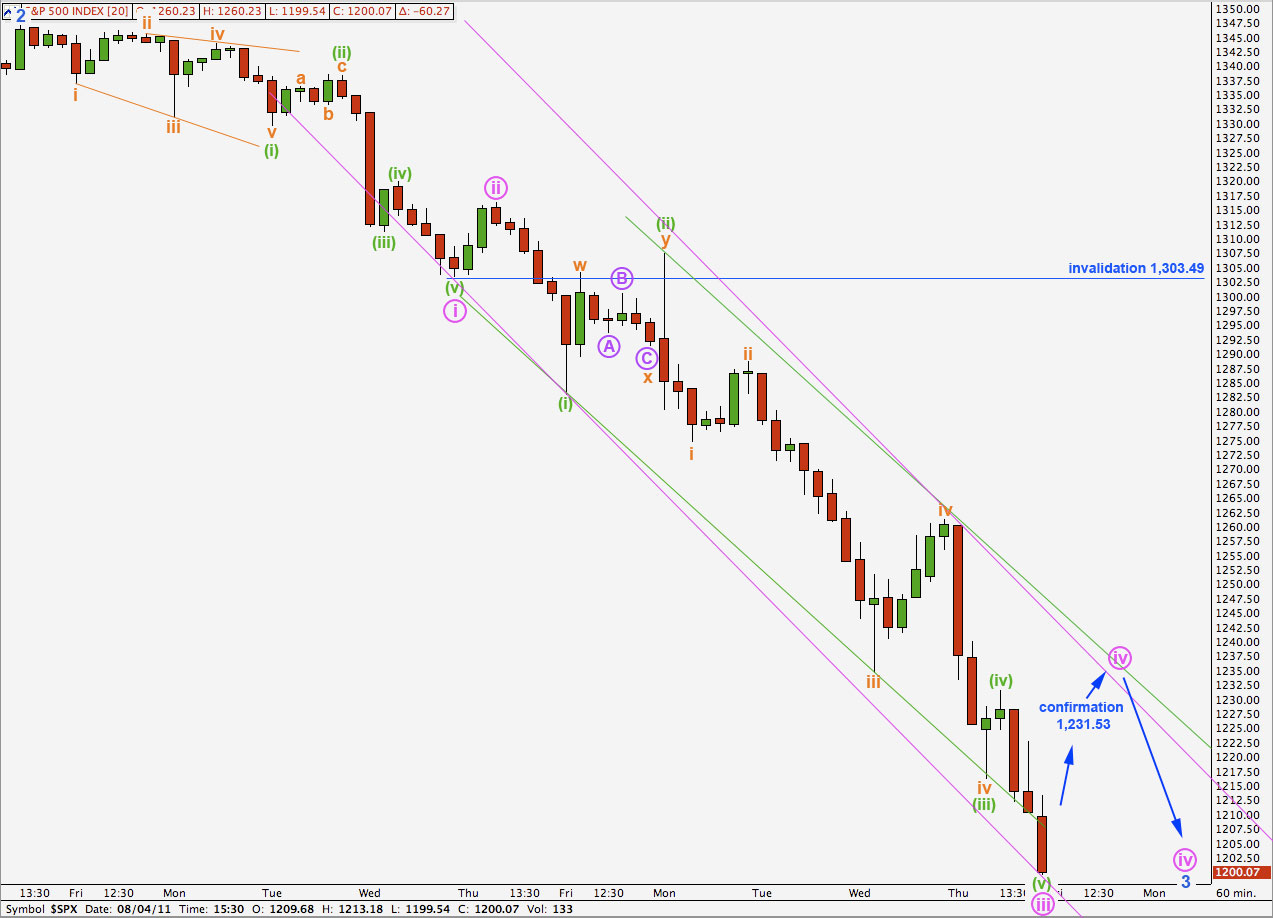
This wave count has a lower probability than the main hourly wave count because there is no divergence between MACD and price as it trends downwards.
If wave iii pink was over here then it is just 2.87 points longer than 2.618 the length of wave i pink.
Ratios within wave iii pink are: wave (iii) green is 3.62 points longer than 2.618 the length of wave (i) green and wave (v) green is 5.28 points longer than 0.618 the length of wave (iii) green.
If price moves above 1,231.53 then we should expect it find resistance about the upper pink trend line. This channel is not drawn using Elliott’s technique completely as the upper edge is a best fit.
Wave iv pink may not move into wave i pink price territory. This wave count is invalidated with movement above 1,303.49.